Download
1 / 12
120 likes | 234 Vues
This study investigates the commuting behavior changes in Downtown Los Angeles, home to extensive transit services. Over the past decade, many tracts have experienced declines in walking and public transit usage, coupled with rising commute times. The research highlights the correlation between new apartment developments and income changes, utilizing geocoding, geoprocessing, and hotspot analysis. This complex analysis examines the impact of increased residential density on commuting patterns, offering valuable insights into transit-oriented development (TOD) and urban living.

E N D
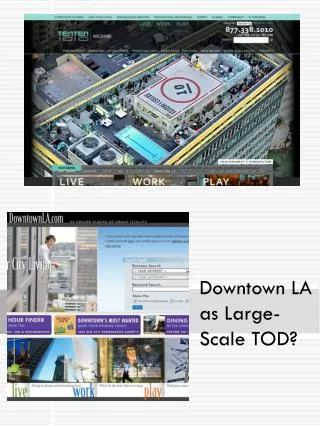
Study Area Study Area
Downtown Has Extensive Transit Service Available Throughout Area
Downtown Has Extensive Transit Service Available Throughout Area
IN THE PAST 10 YEARS, MOST TRACTS HAVE SEEN DECREASES IN WALKING AND PUBLIC TRANSIT USE, AND INCREASES IN COMMUTE TIME Changes in Commuting Behavior
Index Of Commute Changes Index = Public Transit + Walking + Commute Time
Tracts with Most New Apartments Generally Have Seen Increases in Median Income Changes in Median Income by Census Tract
Models Model One Used to Project Tracts Model Two Used to Create Rasters
Skills Used 1) Geocoding – Addresses of apartments and condominiums built between 2000 and 2009 2) Geoprocessing – Clipping . . . lots of clipping 3) Buffering – Buffer of one mile radius around employment centers 4) Indexing – Index of changes in commute patterns 5) Spatial Analyst – Creation and reclassification of rasters 6) Hot Spot Analysis – Identification of locations with most changes in commuting patterns
Skills Used 7) Aggregating Attribute Fields – Creation of fields for changes in commute types and times. 8) Boundary Sub-Set Selection – Selection of Los Angeles tracts from larger shapefile. 9) Graduated Colors – Identification of differing levels income, transit use and walking among tracts. 10) Attribute Sub-Set Selection – Selecting major roads from larger shapefile.