Download
1 / 20
430 likes | 1.95k Vues
K-Chart: Tool for Research Planning & Monitoring. EPH7112 Research Methodology. CONTENTS. Background: Dilemma in Research Planning and Monitoring Existing tools The K Chart Conclusion. SCENARIO 1: GRADUATE STUDIES.

E N D
K-Chart: Tool for Research Planning & Monitoring EPH7112 Research Methodology
CONTENTS • Background: Dilemma in Research Planning and Monitoring • Existing tools • The K Chart • Conclusion
SCENARIO 1: GRADUATE STUDIES • You just started your graduate study. You are looking for a title. Your supervisor/mentor is always busy. • You pick up and photocopy every single article you come across, only to sleep on it than to read it through. • Even when you do finish an article, it’s like reading Peruvian. You don’t know what to get from the paper. • You keep asking yourself; What exactly am I working on? How much should I read? What should be my methodology? How many results should I have? How do I get a novelty?
SCENARIO 2: EMBARKING ON A RESEARCH PROJECT • You are about to embark on a research project. You face a hard time identifying the scope of research and specific problems to solve. • You are planning to have co-researchers/ students, but organizing and coordinating them are not a piece of cake. You want them to work together, not to scream at each other. • You ask yourself; who will do what, and how much? How many sub-projects can be created? How to maximize the outputs? How to produce more papers?
Questions Students/Researchers Wish to Answer Earlier on: • What is the specific title of study • How to identify the problems to study? • How wide/deep is the study? • How much is the literature review? • What do I look for in reading reference papers ? • How do I choose between two (or more) design options? • How do I organize my study? • Should I focus on theory or simulation or what? • How many results should I get? • How do I know whether my results are correct and sufficient? • What if I can not get the target results? • How to arrange the results? • How to cluster for sub-projects? • Who to do what?
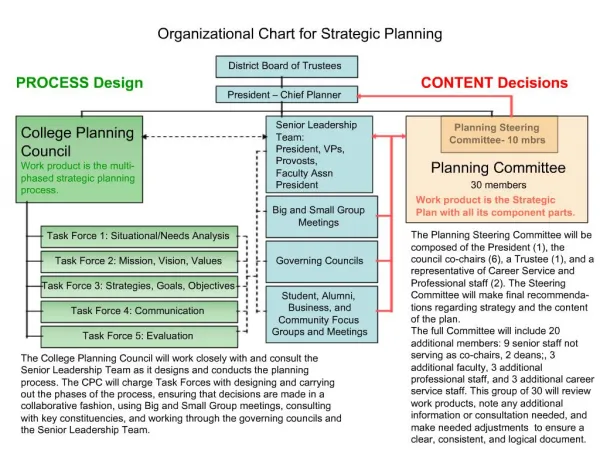
DILEMMA • Many new researchers and graduate students are suffering from lack of guides for research planning/monitoring. • Good researches should have macro and micro level planning/monitoring • Macro level: Activities and Timelines in general • Micro level: Scope of Issues Under Study, Methodology, and Results • Existing tools tend to be too specific in function • K-Chart attempts to provide the Micro-level research planning/monitoring.
EXISTING RnD PLANNING TOOLS • Pareto Chart (80-20 rule) • Ishikawa/ Cause and Effect/Fish bone • Flow Chart • Gantt Chart Existing tools tend to be too specific in function, or too broad
WEAKNESSES OF GANTT CHART 1. Does not clearly show the structure/scope; depth and width of the project 2. Does not provide the designation of issues under study; general issues, complementary issues and focused issues 3. Does not clearly provide the methodologies used 4. Does not clearly show the detail results 5. Does not provide the number of results
WHAT IS A K-CHART? A tool for systematically organizing research • Scope of issues under study, • Methodology,and • Results • Timelines in the form of a Tree Diagram
THE K-CHART LAYERS K-Chart organizes the items in 5 layers: GENERAL TITLE SCOPE OF ISSUES LAYERS METHODOLOGY LAYERS RESULTS LAYERS TIMELINES
General Topic Study of the Performance of ABC System ABC Sub Issues 1 (Types based) Type 1 Type 2 Type 3 Sub Issues 2 (App. Based) App. 1 App.2 App. 3 App.4 A B C Sub-system/ Elements Sub-issues N b1 b2 b3 Methodologies Theory Experiment Simulation Survey Results: Performance Parameters PP 1 PP2 PP 3 Design Parameters DP 1 DP 2 DP 3 DP1 DP 3 STRUCTURE OF A K-CHART Scope Methodology Result
GENERAL TITLE Factors Influencing the Performance of Motor Vehicles SYSTEM Vehicles Sub Issues 1: App. based Air Land Sea Sub Issues 2: Types based Motorcycles Cars Trucks Vans Mini Sedan Wagon Sub Issues 3: Types based Engine Body Tire SUBSYSTEM/ ELEMENTS Theory Experiment Simulation Survey METHODOLOGIES Lab. Tests Field Tests Lab. prototype Eng. prototype Commercial prototype Meas. Techn.1 Meas. Techn.2 Meas. Techn.3 RESULTS: Performance Parameters Acceleration Speed Fuel consumption Design Parameters Tire Width Pressure Tire Height Tire Width Tire Pressure
THE IMPORTANCE OF TITLE A title should indicate: • The systems you are working on • The problems you are solving • Your achievements • Your methodology General Title: General Final Project (Thesis) Title: More specific Paper’s Title: Very specific
THE IMPORTANCE OF ISSUES LAYER • The more detail the layers, the less the assumption, the better • Every time there is a jump between the layers, an assumption is made (thus, a justification is required) • One can choose any way he/she likes to arrange the sequence of layers • However, Issues of the same theme should be in the same layer • The Issues Layers indicate - The scope of critical reviews (what to get from the papers) - The focused issues (designation of issues) - The rationale in choosing issues to study (to move from one level to the next) - The Problem Statement
THE IMPORTANCE OF METHODOLOGY LAYER • To define the specific methods adopted • To designate which methods are of higher priorities • To avoid ambiguities in the approach taken • To reduce assumptions
THE IMPORTANCE OF METHODOLOGY LAYER The Results Layers help in: • Identifying the expected results, and how many of them • Setting the priorities and designation of results • Identifying the possible analyses e.g. comparative studies • Organizing reports/thesis/papers • Designating sub-projects
With A K-Chart, let’s try to answer these questions again …. • What is the specific title of study • How wide/deep is the study? • How much is the literature review? • What do I look for in reading reference papers ? • How do I choose between two (or more) options • How do I decide to move to the next level of study? • How do I develop the objectives of study • What is the methodology (Theory, Simulation, Experiment, Observation, Survey) ? • How many results (# curves, graphs, charts) can be obtained • Which results to be focused on? • How to arrange the results • How many comparisons can be made? • How to cluster for sub-projects • Who to do what?
and more … • How to plan for publication ? • How to construct articles’ titles ? • How to organize the report structure ? • How to plan for a graduate thesis writing? • How to integrate with new ideas ? • How to re-align the area of research when the original plan does not work ?
CONCLUSION • The requirement for a research planning tool is obvious • Existing tools are either too specific or too broad • K Chart provides a more comprehensive micro-level planning