Parameter ?
1 Group Flowchart. Critical Value(s) Table. Jaggia and Kelly (1 st edition). yes. Z using σ pp. 277-288. yes. Z-table. yes. 1. Normal population ?. no. n > 30 ?. Nonparametric. no. σ known ?. mean. no. Normal population ?. no. no. no. n > 30 ?. yes.

Parameter ?
E N D
Presentation Transcript
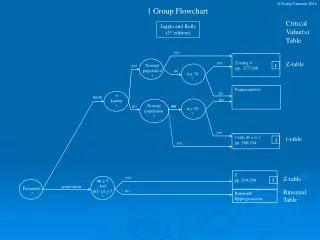
1 Group Flowchart Critical Value(s) Table Jaggiaand Kelly (1stedition) yes Z using σ pp. 277-288 yes Z-table yes 1 Normal population ? no n > 30 ? Nonparametric no σ known ? mean no Normal population ? no no no n > 30 ? yes t with df = n-1 pp. 288-294 t-table 2 yes Z pp. 294-298 yes Z-table 3 np> 5 and n(1- p) > 5 ? proportion Parameter ? no Binomial Table Binomial/ Hypergeometric
Test Statistic Formulas Jaggia and Kelly (1st edition) 1. 3.
Test Statistic Formulas (for printing) Jaggia and Kelly (1st edition) 1. 2. 3.