Comparative Analysis of Brachypodium miRNAs: Structural Predications and Target Identification
This study explores the Brachypodium miRNA family, particularly focusing on Bdi-miR444 and Bdi-miR5200, through predicted secondary structures and target gene predictions using multiple software tools. It highlights unique target subsets identified by CleaveLand and psRNATarget, along with analysis of phased loci and miRNA-target interactions. Representative D-plots demonstrate spatial distribution and cleavage-induced phasing, validating the expression of miRNA across various plant species. The findings enhance our understanding of miRNA functionality and regulatory networks in plants.

Comparative Analysis of Brachypodium miRNAs: Structural Predications and Target Identification
E N D
Presentation Transcript
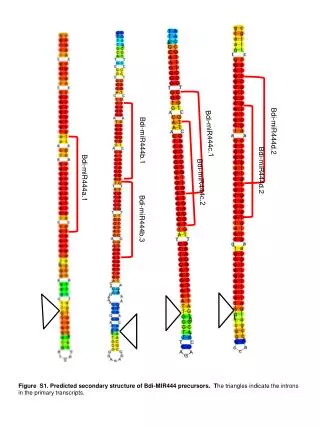
Bdi-miR444d.2 Bdi-miR444c.1 Bdi-miR444b.1 Bdi-miR444d.2 Bdi-miR444a.1 Bdi-miR444c.2 Bdi-miR444b.3 Figure S1. Predicted secondary structure of Bdi-MIR444 precursors. The triangles indicate the introns in the primary transcripts.
Figure S2. Target prediction programs identified distinct subsets of targets. Two programs producing three outputs, CleaveLand, CleaveLandModified (with a native and a modified scoring system), or psRNATarget, were used to predict miRNA targets. The number of predicted targets from each output is indicated. The overlap between the distinct cleavage sites predicted by the programs for all targets is shown. CleaveLand CleaveLand Modified 494 324 98 200 15 2 1008 psRNA Target
Level4 miR160a-f: Auxinresponse factor Level3 miR156b-ij: SBP-box transcription factor Level 3 Level1 Level2 miR164c.2: Transporter Level3 miRNA156b-ij Level 1 miR529 SBP-box transcription factor Figure S3. Representative D-plots for miRNA targets at each stringency level. Sequence abundance was plotted relative to position. Black diamonds indicate the PARE sequence generated by the miRNA cleavage. miRNA and annotation is provided below each graph.
9 5’ CAGGAUUGAUAGGCAUCAGGAA 3’ Phased locus |||| || |||||||||o|| 3’ AUCCUUACCCUCCGUAGUCCUU 5’ Bdi-miR2118b (a) (b) PARE abundance (TP10M) (c) (d) (e) Figure S4 Bdi-miR2118 cleavage induces phasing. (a) Alignment of the intergenic target and Bdi-miR2118b The black arrow indicating the cleavage site and the number on top is the TP10M PARE abundance. (b-c) PARE and small RNA distribution for Bradi4g10171 are provided. Negative numbers indicate the opposite strand. The region shown is 43083163-43084363 on chromosome 4. The black diamond is the PARE site generated by Bdi-miR2118 cleavage. (d-e) The phasing score and small RNA profile for the phased region.
101-1000 11-100 1-10 0 Abundance (TPM) Figure S5. Bdi-miR5200 in diverse plant species. The presence and the abundance of Bdi-miR5200 was analyzed across 31 plant species. miR5200 and its sequence variants, allowing up to three mismatches and two nucleotide shifts at either end, were listed. Colors indicate the level of expression in each library. Each species is indicated by a three-letter code. The information of species codes, library names and the expression data are from http://smallrna.udel.edu/index.php .
(a) Ath-AGO1 (b) Osa-AGO1c (c) Bdi-AGO1a (d) 511-UUCCCGAGCUGCAUCAAGCUA-531 Ath-AGO1 |||||| |||||o||||| | 446-CUCCCGAGCUGCGCCAAGCAA-465 Osa-AGO1c |||||| ||||o|||||| | 311-CUCCCGAACUGCACCAAGCAA-331 Bdi-AGO1a |||||| ||||||||||| | 21-CAGGGCUAGACGUGGUUCGCU-1 miR168a Figure S6. D-plots of AGO1 forArabidopsis, rice and Brachypodium. D-plots of miR168 targets encoding AGO1 in Arabidopsis (a), rice (b), and Brachypodium (c). Ath-AGO1 (AT1G48410), Osa-AGO1c (LOC_Os02g58490), Bdi-AGO1a (Bradi3g51077). PARE data are from Arabidopsis WT inflorescences (GSM280226), rice panicles (GSM476257) and Brachypodium panicles (BDI05). The abundance of all the PARE sequences matching miRNA targets are plotted with blank diamonds. The PARE sequence corresponding to the miRNA-mediated cleavage is represented by a black diamondand an arrow. (d) sequence alignments of miR168 and target sites in AGO genes of Arabidopsis, rice, and Brachypodium.Line indicate perfect match. The circle indicates G:U pairs. The black arrow indicates the cleavage site