Variance Analysis Topic Three
Variance Analysis Topic Three. Why Standard Cost Systems Are Adopted. Standard costing systems enhance planning and control and improve performance measurement. Standard costing systems facilitate product costing.


Variance Analysis Topic Three
E N D
Presentation Transcript
Variance Analysis Topic Three
Why Standard Cost Systems Are Adopted • Standard costing systems enhance planning and control and improve performance measurement. • Standard costing systems facilitate product costing.
Ideal Standards demand maximum efficiency and can be achieved only if everything operates perfectly. Currently attainable standards can be achieved under efficient operating conditions. Kaizen standards reflect a planned improvement and are a type of currently attainable standard. Developing Unit Input Standards 9-3
Usage of Standard Costing Systems Cost Management Planning and Control Decision Making and Product Costing Developing Unit Input Standards 9-4
Cost Assignment Approaches • Direct Direct • MaterialsLaborOverhead • Actual costing system Actual Actual Actual • Normal costing system Actual Actual Budgeted • Standard costing system Standard Standard Standard Manufacturing Costs
Standard Cost Sheet for Corn Chips Standard Standard Standard Price Usage Cost Subtotal Description Direct materials: Yellow corn $0.006 18 oz. $0.108 Cooking oil 0.031 2 oz. 0.062 Salt 0.005 1 oz. 0.005 Lime 0.400 0.01 oz. 0.004 Bags 0.044 1 bag. 0.044 Total direct materials $0.223
Standard Cost Sheet for Corn Chips Standard Standard Standard Price Usage Cost Subtotal Description Direct materials $0.223 Direct labor: Inspectors $7.000 0.0070 hr. $0.049 Machine operators 10.000 0.0008 hr. 0.008 Total direct labor 0.057 Overhead: Variable overhead 3.850 0.078 hr. $0.030 Fixed overhead 32.050 0.0078 hr. 0.250 Total overhead 0.280 Total standard unit cost$0.560
During the first week of March, 100,000 packages of corn chips are produced. The standard quantity of yellow corn meal per package is 18 ounces.
Standard Quantity of Materials Allowed SQ = Unit quantity standard x Actual output = 18 x 100,000 = 1,800,000 ounces Standard Hours Allowed SH = Unit labor standard x Actual output = 0.0008 x 100,000 = 80 direct labor hours Total variance = Price variance +Usage variance = (AP x AQ) – (SP x SQ)
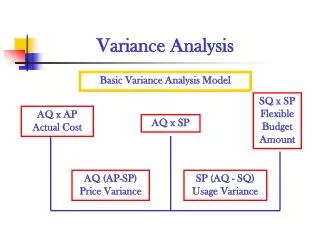
1. AP x AQ (Actual Quantity of Input at Actual Price) 2. SP x AQ (Actual Quantity of Input at Standard Price) 3. SP x SQ (Standard Quantity of Input at Standard Price) Price Variance (1-2) Usage Variance (2-3) Budget Variance (1-3) Variance Analysis: General Description
Unfavorable (U)variances occur whenever actual prices or usage of inputs are greater than standard prices or usage. Favorable (F) variance occurs whenever actual prices or usage of inputs are less than standard prices or usage
x x x x x x Control Chart Cost $110,000 $100,000 $ 90,000 Time
Variance Analysis and Accounting: Investigating Variances: Because random variations around the standard are expected, management should establish an acceptable range of performance. The acceptable range is the standard, plus or minus one allowable deviation. The upper control limit is the standard plus the allowable deviation and the lower control limit is the standard minus the allowable deviation. 1-13
Actual Costs Budgeted Costs Total Variance Corn $5,382.00 $5,238.00 $144.00 U Inspection labor 2,646.00 2,376.50 269.50 U Variance Analysis: Materials and Labor Actual production 48,500 bags of corn chips Actual cost of corn 780,000 ounces of $0.0069 = $5,382 Actual cost of inspection labor 360 hours at $7.35 = $2,646
AQ x AP 780,000 x 0.0069 $5,382 AQ x SP 780,000 x $.0.0060 $4,680 SQ x SP 873,000 x $0.0060 $5,238 $702 U Price Variance $558 F Usage Variance $144 U Total Variance Variance Analysis: Columnar Approach
Material Price Variance MPV = (AP – SP)AQ The actual price per unit The standard price per unit The actual quantity of material used
Material Price Variance MPV = (AP – SP)AQ = ($0.0069 – $0.0060)780,000 = $0.0009 x 780,000 = $702 U
Direct Materials Usage Variance MUV = (AQ – SQ)SP The actual quantity of materials used The standard quantity of materials allowed for the actual output The standard price per unit
Direct Materials Usage Variance MUV = (AQ – SQ)SP = (780,000 – 873,000)($0.006) = 93,000 x $0.006 = $558 F
Labor Rate Variances LRV = (AR – SR)AH The actual hourly wage rate The standard hourly wage rate The actual direct labor hours used
Labor Rate Variances LRV = (AR – SR)AH = ($7.35 – $7.00)360 = $0.35 x 360 = $126 U
AH x SR 360 x $7.00 $2,520 AH x AR 360 x $735 $2,646 SH x SR 339.5 x $7.00 $2,376.50 $126 U Rate Variance $143.50 U Efficiency Variance $269.50 U Total Variance Labor Variances: Columnar Approach
Labor Efficiency Variances LEV = (AH – SH) SR The actual direct labor hours used The standard direct labor hours that should have been used The standard hourly wage rate
Labor Efficiency Variances LEV = (AH – SH)SR = (360 – 339.5)$7 = 20.5 x $7 = $143.50 U
Variable Overhead Variances Variable overhead rate (standard) $3.85/DLH Actual variable overhead costs $1,600 Actual hours worked 400 Bags of chips produced 48,500 Hours allowed for production 373.3 Applied variable overhead $1,456
VO Rate x Actual Hours $1,540 Actual VO $1,600 VO Rate x Standard Hours $1,456 $60 U Spending Variance $84 U Efficiency Variance $144 U Total Variance Variable Overhead Variances: Columnar Approach
Variable Overhead Spending Variances VOSV = (AVOR x AH) – (SVOR x AH) = (AVOR – SVOR)AH = ($4.00 – $3.85)400 = $60 U
Crunch Chips, Inc. Flexible Budget Performance Report For the Week Ended March 8, 2004 Cost Formula Actual Costs Spending Variance Budget Gas $3.00 $1,190 $1,200 $10 F Electricity 0.78 385 312 73 U Water 0.07 25 28 3 F Total cost $3.85 $1,600 $1,540 $60 U
Crunch Chips, Inc. Performance Report For the Week Ended March 8, 2004 Budget for Standard Hours Actual Costs Spending Variance Cost Formula EfficiencyVariance Budget Gas $3.00 $1,190 $1,200 $10 F Electricity 0.78 385 312 73 U Water 0.07 25 28 3 F Total cost $3.85 $1,600 $1,540 $60 U • $1,135 $65 U • 295 17 U • 26 2 U • $1,456 $84 U
Hours allowed to produce 3,000,000 bags of chips: 0.078 x 3,000,000 = $23,400 Fixed Overhead Variances Budgeted or Planned Items Budgeted fixed overhead $749,970 Practical activity 23,400 direct labor hours Standard fixed overhead rate $32.05 Actual Results Actual production 2,750,000 bags of chips Actual fixed overhead cost $749,000 Standard hours allowed for actual production 21,450
Total fixed overhead variance $749,000 – $687,473 = Total Fixed Overhead Variances Applied fixed overhead Standard fixed overhead rate x Standard hours = = $32.05 x 21,450 = $687,473 (rounded) = $61,527 underapplied
Budgeted FO $749,970 Actual FO $749,000 Applied FO $687,473 $970 F Spending Variance $62,497 U Volume Variance $61,527 U Total Variance Fixed Overhead Variances: Columnar Approach
Crunch Chips, Inc. Performance Report For the Year Ended 2004 Actual Costs Budgeted Cost Fixed Overhead Items Variance Depreciation $530,000 $530,000 $ ---- Salaries 159,370 159,970 600 F Taxes 50,500 50,000 500 U Insurance 9,130 10,000870 F Total fixed overhead $749,000 $749,970 $970 F
Volume Variance Volume variance = $32.05(23,400 – 21,450) = ($32.05 x 23,400) – ($32.05 x 21,450) = $749,970 – $687,473 = Budgeted fixed overhead – Applied fixed overhead = $62,497 U
Yield 120 lbs. Yield ratio: 0.75 (120/160) Standard cost of yield (SP): $0.80 per pound ($96/120 pounds of yield) MIX AND YIELD VARIANCES: MATERIAL AND LABOR Standard Mix Information: Direct Materials Direct Material Mix Mix Proportion SP Standard Cost Peanuts 128 lbs. 0.80 $0.50 $64 Almonds 32 lbs. 0.20 1.00 32 Total 160 lbs. $96
Malcom Nut Company produces a batch of 1,600 pounds and produces the following actual results: Direct Material Actual Mix Percentages Peanuts 1,120 lbs. 70 % Almonds 480 30 Total 1,600 lbs. 100 % Yield 1,300 lbs. 81.3 %
Standard Mix SM = Standard mix proportion x Total actual input quantity SM(peanuts) = 0.80 x 1,600 pounds = 1,280 pounds SM(almonds) = 0.20 x 1,600 pounds = 320 pounds
Standard Mix Mix Variance = (AQ – SM)SP Direct Material AQ SM AQ – SM SP (AQ – SM)SP Peanuts 1,120 1,280 -160 $0.50 $-80F Almonds 480 320 160 1.00 160U Mix variance $-80 U
Yield variance= (Standard yield – Actual yield)SP y Direct Materials Yield Variance Standard yield = Yield ratio x Total actual inputs Yield variance= (1,200 – 1,300)$0.80 = $80 F
Standard Mix Information • Labor TypeMixMix ProportionSPStandard Cost • Shelling 3 hrs. 0.60 $ 8.00 $24 • Mixing 2 hrs. 0.40 15.00 30 • Total 5 hrs. $54 • Yield 120 lbs. • Yield ratio: 24 = (120/5), or 2,400% • Standard cost of yield (SP ): $0.45 per pound ($54/120 pounds of yield) y
Standard Mix Information • Malcom processes 1,600 pounds of nuts and produces the following actual results: • Shelling 20 hrs. 40% • Mixing 30 hrs. 60% • Total 50 hrs. 100% • Yield 1,300 lbs. 2,600% • *Uses 50 hours as the base. Labor Type Actual Mix Mix Percentages*
Direct Labor Mix Variance • Labor Type AH SM AH – SM SP (AH – SM)SP • Shelling 20 30 -10 $ 8.00 $-80F • Mixing 30 20 10 15.00 150U • Direct Labor mix variance $70 U
Direct Labor Yield Variance • Using the standard mix information and the actual results, the yield variance is computed as follows: • Yield variance = (Standard yield – Actual yield)SP • = [(24 x 50) – 1,300]$0.45 • = (1,200 – 1,300)$0.45 • = $45 F • The yield variance is favorable because the actual yield is greater than the standard yield. y