Download
1 / 46
470 likes | 634 Vues
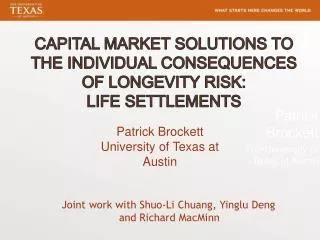
Capital Market Solutions to the Individual Consequences of Longevity Risk: Life settlements. Patrick Brockett The University of Texas at Austin. Patrick Brockett University of Texas at Austin. Joint work with Shuo -Li Chuang, Yinglu Deng and Richard MacMinn. Outline of Talk.

E N D
Capital Market Solutions to the Individual Consequences of Longevity Risk: Life settlements Patrick Brockett The University of Texas at Austin Patrick Brockett University of Texas at Austin Joint work with Shuo-Li Chuang, Yinglu Deng and Richard MacMinn
Outline of Talk • Background • What is longevity risk • How important is it • Where are we and where are we going • Modeling Longevity Risk • Capital Market Solutions to Individual Longevity Risk • Annuities • Life Settlements • Conclusions
Life expectancy at birth 1900 to 2000 What is Longevity Risk? 79 74 Source: U.S. Vital Statistics, 2004
Longevity risk is a real, underestimated, uncertain and slow-burning risk Age 65
Thank you Example mortality series : USA Data Figure 1900-2004 Historical Mortality Rates
Where Did The Mortality Improvements Come From?. Cutler and Meara, Sept 2001, Changes in the Age Distribution of Mortality Over the 20th Century
We Care About This Topic Because Longevity Risk is a Key Factor in Planning on How to Translate Assets into Lifetime Income Security • For individuals, governments and corporations • E.g., for individuals, for example: • Conditional on Achieving Age 65, Probability of Dying by 75 is 0.254 for Men, 0.189 for Women • Conditional on Age 65, Probability of Living to 90 is 0.181 for Men, 0.275 for Women How do we fund this?
Dependency Ratio: The workers in the Middle Pay for the Young and Old
Also, Individual’s Mortality Perceptions Are Biased (so planning is bad) • Hurd / McGarry Compare Subjective Mortality Probabilities in Health and Retirement Survey with Actual Mortality Rates • Men: In Survey, Average Estimated Survival Probability to Age 75: 0.622, but “Actual” from Mortality Table: 0.594. Similarly, for Women These Numbers Are: 0.663 and 0.746. • Survival to 85: Subjective from survey: 0.388 for Men (0.242 “actual”), 0.460 (0.438) for Women
Cost of longevity risk to society • Global pension liabilities = $23trn • Roger Lowenstein* in While America Aged (2008) discusses “how pension debts ruined General Motors, stopped the New York subways, bankrupted San Diego, and loom as the next financial crisis” • Author of When Genius Failed • The impact of the longevity risk • In the US, using up-to-date mortality tables increases pension payments liability 8% for a male born in 1950 • In the U.K., true accounting for longevity doubles the aggregate pension deficit from £46 billion to £100 billion of FTSE100 corporation pensions • In the U.S., the new mortality assumptions for pension contributions, increase pension liabilities by 5-10%
So What is an individual to do? • Buy annuities • If you have real property: consider reverse mortgage on the property • If you have life insurance, consider selling it on a secondary market known as the life settlement market
Individuals buying annuities is a useful risk management strategy, but people just don’t do it • Fear of loss of control/trust • Bequest Motive • Uncertain future needs • Decision regret • In the UK, people are forced by governmental mandate to annuitize 75% of their pension funds at retirement • Still only a partial solution • US (and other parts of the world) would have trouble enforcing such a mandate
Modeling Mortality • Necessary for assessing future liabilities • Long (but recent history) • Pricing financial instruments that incorporate longevity risk requires looking forward mortality tables and models
Life Settlement Description • A life settlement is a financial arrangement whereby the third party (or investor) purchases a life insurance policy from the person who originally purchased a life insurance policy. • This third party pays the insured an amount greater than the cash surrender value of the policy -- in effect, the trade-in value of the policy as determined by the originating insurance company-- but less than the face value (or the death benefit). • It can be a win-win situation, as the investor can obtain a return on their initial investment and premium payments once the death benefit becomes payable and the owner of the policy obtains more money than they otherwise could obtain by surrendering their policy. • It is estimated that in the past five years more than $40 billion of face value has been sold in the life settlement market and the market size will grow from $13 billion in 2004 to $161 billion over the next few decades
Brief History • Longevity risk traditionally viewed though its impact on pensions, social security systems and corporate defined benefit plan solvency, but the life settlement market for individuals is even more vulnerable to longevity risk. • Illustrative of this is what happened to the viatical settlement market, the precursor of life settlement market. • AIDS patients sold their life policies. Profitable to investors, until 1996 when papers were presented at the International AIDS Conference in Vancouver, that gave evidence of a new drug capable of substantially reducing, perhaps even to zero, the level of HIV in its infectees.
Brief History • The effect was evident in the collapsed value of viatical settlement firms, and significant decrease in prices offered to AIDS victims for insurance policies since it now might take substantially longer to mature, their value plummeted. • As market for viatical settlements plunged, companies, looked for alternatives. They expanded life insurance purchases to the elderly. Elderly with estimated low life expectancies chosen because a low life expectancy meant a greater possibility of profiting early. Today, this life settlement market has increasing potential as baby boomers are enter old age • To create distance between the association with AIDS and the negative connotation that the term “viatical settlement” had, companies chose the different title, “life settlement.”
Life Settlement Pricing Factors • A life settlement can depend on the following characteristics of the policy being settled: • 1. The insurance carrier, • 2. The face value (or benefit), • 3. The age of the insured person, • 4. The gender of the insured person, • 5. The premium, • 6. The issue date, • 7. The estimated life expectancy of the insured, • 8. The primary diagnosis of the insured’s illnesses if the insured is in impaired health • 9. The bidding or asking price of the policyholder.
Life settlement Pricing • The main factor in the life settlement securities pricing currently is the estimation of the life expectancy of the insured (and the premium payments), but other information may also be available. • The life expectancy of the insured at the time of sale (settlement) is often considered in the pricing as the major random variable which influences the sales price to the insured when he sells his life insurance policy to the third party as a life settlement.
Life settlement Pricing • A common method of pricing at the beginning was “deterministic” pricing. One treats the contract as one where the person lives to their life expectancy, and then dies • Viewed like a bond with a principal repayment equal to the death benefit paid at the time of life expectancy • Negative coupons of size equal to the premiums payable up to the time of life expectancy
Problem with deterministic pricing Jensen’s inequality says for any convex function f and any random variable Z, E[f(Z)] ≥ f(E[Z]). Thus, since the discount function vT is convex in T, according to Jensen’s inequality, using the expected life time E[T] only and pricing the product like one would an E[T]-year bond with a pay off of vE[T] , v being the discount rate, results in incorrect pricing. This price vE[T] is always smaller than the value of the E[vT] which is the true expected net present value. Thus treating the life settlement as a bond of duration E[T] is underprices the value of the payoff and is not fair to the policyholder
Pricing Issues This carries over into the time zero price of the life settlement. If P is the premium to be paid at the beginning of each year then the buyer pays an amount equal to The time zero value of the life settlement, X is a convex function of T, the future lifetime since vT is convex and Again according to Jensen’s inequality, using the expected life time E[T] only and pricing the product as X(E[T]) instead of E[X(T)] results in systematically underpaying the insured.
Pricing Issues • Moral: We should use the entire probability distribution for pricing the life settlement, not just the expected lifetime of the insured. • Problem: While E[T] can be assessed by a medical underwriter, usually the probability distribution of T is not known, cannot be assessed effectively by the life underwriter, and reasonable candidate distributions (e.g., impaired life mortality tables) for T will not have the specified value of E[T] consistent with the medical underwriter’s assessment. • We may also have other information (e.g., variance, or survival probability for a specified period, or relative mortality risk statistics from the medical literature), and this should be incorporated • The medical underwriter may be specifying median instead of mean, or likelihood of death within a window of years may be specified
Approaches to Modeling • We want to use a “standard” or pre-specified distribution (or life table) for T, but these will not be consistent with medical underwriter. • How do we adjust a standard mortality table to obtain a new mortality table for the individual that can reflect (be consistent with) this known information?
An Information Theoretic Approach • The statistical methodology we propose is based upon information theory for adjusting mortality tables to obtain exactly some known individual characteristics, while obtaining a table that is as close as possible to a standard one. • In this way, the method provides more accurate projection and evaluation for the life settlement products, through incorporating more statistical information of the insured’s future life time. One can then price life settlements using the whole life distribution rather than just life expectations
Information Theory Approach to Getting a Mortality Model for Pricing For distinguishing between two densities on the basis of an observation t, a sufficient statistic is the log odds ratio in favor of the observation having come from in favor of g. It is the amount of information contained in a observation t for discriminating in favor of f over g. In a long sequence of observations from , the long-run average or expected log odds ratio in favor of f is I(f|g) = This reflects the expected amount of information for discriminating between f and g. Note that I(f|g) ≧0 and = 0 if and only if f=g . Thus, the size of is a measure of the closeness of the densities f and g. For a given g, one can minimize I(f|g) over f to find the closest f. If we have constraints, we can do a constrained optimization. E.g., if the mean is give as m, then we have constraints:
Information Theory • To phrase the problem mathematically, we desire to find a vector of probabilities that solves the problem: • If we have constraints E[ai(T)] = qi, i=1, …, k, then Brockett, Charnes and Cooper (1980) show that the problem has a unique solution, which is: • The parameters can be obtained easily as the dual variables in an unconstrained convex programming problem:
Information Theoretic life Settlement Adjustment • In particular, if the mean life expectancy is give as m, and a standard mortality table is given with probability of death at exact year k given as gk, then the problem becomes to find the adjusted mortality table probabilities fk, that satisfy • Minimize I(f|g) over all possible f subject to
Solution The solution is: fk = gkexp(b0+b1k) where the b’s are selected so the two constraints are satisfied. This gives the best fitting (least distinguishable from the standard) mortality table that satisfies the underwriter’s expectation. We can use this for pricing.
Example (Life Policy from State Farm) Female bought policy at age 40 in 1986, is being settled in 2006 at age 70 Medical underwriter says life expectancy is 8.5 years, but 2001 CSO table on which the policy is based says life expectancy is 16.4 years
Even using a disabled life table without adjustment underprices
Present Value of Cash Flows (excluding initial purchase price)
Other types of information can be incorporated – e.g., relative risk Consider a person who has experienced a life event that has changed their medical information. For example a spinal cord injury . We know relative mortality impact. How do we adjust life table?
We assume the level of injury (ip,cp,iq,cq) influences mortality rate relative to standard by increasing additively, e.g for incomplete paraplegics, mortality is = mx+mip. The question is how to estimate such that the adjusted mortality table has the 7 year mortality ratios as given in the previous table. We also need the number of exposure units Ex in each age group (to get average age at death)constraint
Getting a new adjusted mortality Table Age at death constraint: same for observed and predicted Solving these we obtain (3)
Conclusion • We have shown how to price life settlements and how to assess the risk by Monte Carlo simulations • In adjusting a standard mortality table to reflect known information, often the pricing result is not very sensitive to the original standard mortality table, but is sensitive to the discount rate • Other information can be incorporated as well