4-Development Environment
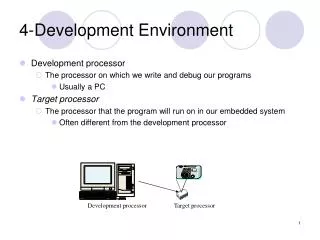
4-Development Environment. Development processor The processor on which we write and debug our programs Usually a PC Target processor The processor that the program will run on in our embedded system Often different from the development processor. Development processor. Target processor.

4-Development Environment
E N D
Presentation Transcript
4-Development Environment • Development processor • The processor on which we write and debug our programs • Usually a PC • Target processor • The processor that the program will run on in our embedded system • Often different from the development processor Development processor Target processor
Asm. File C File C File Compiler Assembler Binary File Binary File Binary File Linker Debugger Exec. File Profiler Verification Phase Implementation Phase Library Development Environment • Compilers • Cross compiler • Runs on one processor, but generates code for another • Assemblers • Linkers • Debuggers • Profilers
Running a Program • If development processor is different than target, how can we run our compiled code? Two options: • Download to target processor • Simulate • Simulation • One method: Hardware description language • But slow, not always available • Another method: Instruction set simulator (ISS) • Runs on development processor, but executes instructions of target processor
Instruction Set Simulator For A Simple Processor #include <stdio.h> typedef struct { unsigned char first_byte, second_byte; } instruction; instruction program[1024]; //instruction memory unsigned char memory[256]; //data memory int run_program(int num_bytes) { int pc = -1; unsigned char reg[16], fb, sb; while( ++pc < (num_bytes / 2) ) { fb = program[pc].first_byte; sb = program[pc].second_byte; switch( fb >> 4 ) { case 0: reg[fb & 0x0f] = memory[sb]; break; case 1: memory[sb] = reg[fb & 0x0f]; break; case 2: memory[reg[fb & 0x0f]] = reg[sb >> 4]; break; case 3: reg[fb & 0x0f] = sb; break; case 4: reg[fb & 0x0f] += reg[sb >> 4]; break; case 5: reg[fb & 0x0f] -= reg[sb >> 4]; break; case 6: pc += sb; break; default: return –1; } } return 0; } int main(int argc, char *argv[]) { FILE* ifs; If( argc != 2 || (ifs = fopen(argv[1], “rb”) == NULL ) { return –1; } if (run_program(fread(ifs,program, sizeof(program)) == 0) { print_memory_contents(); return(0); } else return(-1); }
(a) (b) Implementation Phase Implementation Phase Verification Phase Development processor Debugger/ ISS External tools Programmer Verification Phase Emulator Testing and Debugging • ISS • Gives us control over time – set breakpoints, look at register values, set values, step-by-step execution, ... • But, doesn’t interact with real environment • Download to board • Use device programmer • Runs in real environment, but not controllable • Compromise: emulator • Runs in real environment, at speed or near • Supports some controllability from the PC
Creation of new project • Chose a project name and location • Set the path under \LBE\ • Click Create Project
Project created from template • Examine/ modify created source codes.
If needed, setup the port to COM1, and set Derivative to MC9S12DG256B
True time Simulator & Real time Debugger tool will start • Ready to debug the program (single step)