Download
1 / 25
250 likes | 279 Vues
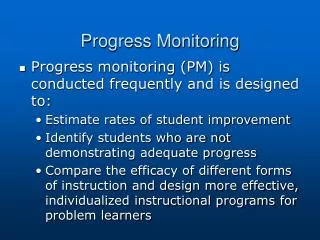
This workshop highlighted indicators for progress monitoring under the SDGs, global and regional measurement, and national level progress tracking. It encompassed key conventions like Basel, Rotterdam, and Stockholm Conventions, addressing sound management of chemicals and waste. Various indicators, reporting mechanisms, and challenges were discussed, reflecting the commitment towards sustainable development in handling chemicals and waste.

E N D
Indicators of progress and monitoring Integrated National Implementation of SDGs and International Chemicals and Waste Agreements International Expert and Stakeholder Workshop Geneva, Switzerland, 11-13 April 2016 Tatiana Terekhova (Secretariat of the Basel, Rotterdam and Stockholm Conventions Carolyn Vickers (WHO) Brenda Koekkoek (UNEP Chemicals and Waste Branch, SAICM Secretariat)
Outline PART I: Sound management of chemicals and waste indicators under the SDGs PART II: Measuring progress at the global and regional levels PART III: Measuring progress at the national level I II III
Brief overview of the process • In 2014, the UN General Assembly tasked the United Nations Statistical Commission (UNSC) with the development of the SDG indicator framework (by March 2016). • In 2015, the UNSC established the Inter-agency and Expert Group on Sustainable Development Goal Indicators (IAEG-SDGs) to develop the SDG indicators for adoption to the UNSC. • The IAEG-SDG includes country members with UN agencies and others as observers. • In Feb 2016, the IAEG submitted the indicators for endorsement. In March 216, the UNSC adopted the proposed list of indicators.
Tiered approach • Tier I: indicators where there is an adopted methodology and data available for many countries; • Tier II: indicators where there is a methodology but it has not been adopted, and less data for countries; • Tier III: indicators where there is not an agreed methodology.
PART II: Measuring progress at the global and regional levels
Measuringprogressunder BRS and Minamata • Basel Convention (183 Parties): annual national reports, Strategic Framework (including 11 indicators) • Percentage of parties that require the separation of hazardous wastes from non hazardous other wastes; • Percentage of parties that have national inventories on the generation and disposal of hazardous wastes and other wastes • Percentage of selected Convention waste streams reused, recycled or recovered. • Rotterdam Convention (155 Parties): Import responses and final regulatory actions • Stockholm Convention (180 Parties): National reports every 4 years, National Implementation Plans, Effectiveness Evaluation and Global Monitoring Plan (including outcome and process indicators) • Annual releases of specific POPs to air, water, land, releases from products and residues. The data is disaggregated by source category (e. g. ferrous and non-ferrous metal production, transportation, open burning processes, etc.), amounts of specific POPs produced, exported (with specification of purpose, e. g. for permitted use, final disposal), as well as the quantity of production, export/import, destruction of PCBs. • Minamata Convention
Statistics • Number of Parties submitted reports under the Stockholm Convention • First reporting 45 / Second reporting 95 / Third reporting 71 • Number of Parties submitted NIPs under the Stockholm Convention: 162 (out of 180 Parties) • Reporting rate under Basel Convention: approx 50 %
Sampling of PFOS in water: data availability within the GMP
Trends in concentrations of indicator PCB in human milk (Sum 6 PCB; ng/g fat) Trends in concentrations of indicator PCB in human milk (Sum 6 PCB; ng/g fat) and Minamata under BRS and Minamata
10 Indicators of progress 1. Countries with National Profiles 2. Countries implementing the GHS 3. Countries with PRTR 4. Countries with Poisons centres 5. Countries with Controls for lead in decorative paint 6. Country achievement of chemical core capacities for the International Health Regulations (2005)
7. Countries with pesticide legislation referencing or based on the FAO/WHO Code of Conduct on Pesticide Management 8. Countries with effective pesticide evaluation and registration system and/or participating in a regional scheme 9. Countries taking action to reduce risks from pesticides 10. Parties to the BRS and Minamata Conventions
Periodicreviewsunder SAICM • The ICCM is responsible to undertake periodic reviews of SAICM. • ICCM2 adopted 20 indicators to review progress towards the 2020 goal. • Two progress reports and a baseline developed to-date, based on responses to an on-line tool: • Second report: 2011–2013 (SAICM/ICCM.4/3) • First report: 2009-2010 (SAICM/ICCM.3/INF/6) • Baseline report: 2006-2008 (SAICM/ICCM.3/INF/5) • 2011-2013 Report: 101 responses to the on-line tool. • 83 Governments, 5 IGOs, 1 private sector NGO and 12 civil society NGOs.
Challenges with SAICM periodicreviews • The activity-based indicators can be subjective: • based on self-assessment; • open to variability of responses. • Limited reporting rates. • Does not identify core achievements or support in setting priorities.
SAICM 11 Basic Elements • Legal frameworks that address the life cycle of chemicals and waste • Relevant enforcement and compliance mechanisms • Implementation of chemicals and waste-related multilateral environmental agreements, as well as health, labour and other relevant conventions and voluntary mechanisms • Strong institutional frameworks & coordination mechanisms among relevant stakeholders • Collection & systems for the transparent sharing of relevant data and information among all relevant stakeholders using a life cycle approach, such as the implementation of GHS • Industry participation and defined responsibility across the life cycle, including cost recovery policies and systems as well as the incorporation of sound chemicals management into corporate policies and practices • Inclusion of the sound management of chemicals and waste in national health, labour, social, environment and economic budgeting processes and development plans • Chemicals risk assessment and risk reduction through the use of best practices • Strengthened capacity to deal with chemicals accidents, including institutional strengthening for poison centres • Monitoring and assessing the impacts of chemicals on health and the environment • Development and promotion of environmentally sound and safer alternatives
Measuring progress at national level • No common national approach towards tracking Sound Management of Chemicals and Waste. • Inclusion of chemicals and waste management in many of the SDGs is likely to require more quantitative results-based evidence and data collection in the future. Questions for consideration: • What does it mean to achieve the 2020 goal at the national level? • How will you go about measuring progress at the national level? • How might countries develop a common national self-assessment system for chemicals and waste?
Measuring progress on chemicals and waste in the SDG context