Barloworld Industrial Solutions: Excellence in Business Solutions
320 likes | 416 Vues
Barloworld offers leading industrial brands backed by exceptional service to help customers excel. The company values integrity, ethics, and a dedicated global team, focusing on quality improvement and sustainable growth.

Barloworld Industrial Solutions: Excellence in Business Solutions
E N D
Presentation Transcript
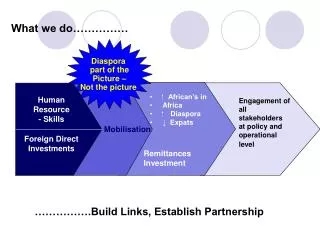
What we do Business solutions through leading industrial brands, supported by service, relationships and attention to detail, that make our customers’ businesses excel
Understanding Barloworld • The key to Barloworld is howwe do things, not what we do • A strong, stable, committed, innovative, dynamic global management team • A deep culture of integrity, ethics and winning
In November 2002 we said: “VBM has plenty of scope to deliver value” Community (social and environment) Shareholders Employees Customers
H1 2003: strong operating performance • Operating profit up 41% • Operating profit margins 6.5% (H1 02: 4.7%) • Drive to improve quality of business • 58% of profits outside SA (H1 02: 52%)
Steel Tube Other Coatings Scientific Capital Equipment Cement & Lime Australia & Asia North America Rest of Africa Industrial Motor Distribution SA Europe H1 2003:sources of profit Result by geography Operating profit by line of business
In May 2003 we said:“outlook for H2 2003 cautiously optimistic” • Expecting a good H2 operating performance • HEPS growth subject to Rand volatility and strength • Focus on improving quality of existing businesses • Further acquisitive growth
H2 FY 2003 Exchange rate impact:rand strength continues in H2 2003 20 2002 R:£ 15 Month end exchange rate 2003 R:£ 2002 R:US$ 10 2003 R:US$ 5 0 Oct Nov Dec Jan Feb Mar Apr May Jun Jul Aug Sep • Adverse impact of Rand strength: • IAS 39/21 charge to income statement • Translation effect on non-SA earnings
Region Drivers for Barloworld Conditions South Africa GFCF & mining Mixed Rest of Africa Mining and infrastructure (Botswana, Namibia, Angola) Buoyant Spain Infrastructure spend & GDP High level plateau UK GDP and manufacturing activity Slow growth USA GDP, distribution & manufacturing in south east Green shoots Australia GDP & housing Good growth slowing H2 2003 trading environments
Capital Equipment Spain:after market continues growing 100,000 98,000 96,000 94,000 92,000 Parts Sales Oct - July (000 Euros) 90,000 88,000 86,000 84,000 82,000 2001 2002 2003
Capital Equipment Spain: new equipment market softer but remains at high levels 250 200 150 Barloworld New Unit Sales 100 50 0 Apr 02 Apr 03 Jun 01 Dec 01 Aug 01 Aug 02 Oct 02 Jun 03 Feb 02 Jun 02 Feb 03 Dec 02 Oct 01
Capital Equipment Spain: rental business continues to expand 3500 30000 3000 25000 2500 20000 2000 Number of Units 15000 1500 Fleet Cost (000 Euros) 10000 1000 5000 500 0 0 Oct 01 Jan 02 Apr 02 Jul 02 Oct 02 Jan 03 Apr 03 Units Fleetcost
1200 1000 800 (October - July)* 600 400 200 0 2002 2003 Capital Equipment Southern Africa:market buoyant Barloworld unit sales New Units Used Units * South Africa, Botswana and Namibia
1200 1000 800 600 400 200 0 2001 Oct 2002 Oct 2002 Jul 2003 Jul 2002 Jan 2002 Apr 2003 Jan 2003 Apr Capital Equipment South Africa:growing our rental business Units in fleet (month end) Rent to Rent (Plant hire) Rental Services (generators, compactors etc) Lift Trucks (short & long term) /10
60000 50000 40000 Equipment Sales (R 000's) 30000 20000 10000 0 2002 2003* Capital Equipment Southern Africa: strong growth in Angola Mozambique & Malawi Zambia Angola * 2003 figures are Oct - July
Industrial Distribution Europe:lift truck volumes improving UK & Belgium (units) October to July Barloworld unit deliveries
Industrial Distribution US:lift truck volumes improving US (units) October to July Barloworld unit deliveries
18000 16000 14000 12000 10000 No. of Units 8000 6000 4000 2000 0 Jul 03 Jun 01 Jun 02 Jun 03 Mar 01 Mar 02 Mar 03 Dec 00 Sep 01 Dec 01 Sep 02 Dec 02 US Europe Industrial Distribution:lift truck rental fleets continue to grow
Industrial Distribution US: Freightliner volumes improving US (units) October to July Barloworld unit deliveries
1400 1200 1000 Units 800 600 400 200 Jul-03 Jun-03 Oct-02 Nov-02 Jan-03 Apr-03 Mar-03 Feb-03 May-03 Sep-02 Dec-02 Industrial Distribution US: Freightliner order book has green shoots
SA Motor: demand impacted by high real interest rates Motor industry stats for 10 months to July 350000 300000 250000 200000 Unit sales 150000 100000 50000 0 2001 2002 2003 Dealer Government Rental Companies Single units
Coatings South Africa :flagship brandfocus – higher av. prices 25 20 15 Av price per litre sold 10 5 0 2001 2002 2003 October to July Barloworld average prices • Decorative market growing 3 to 5% p.a. • Opportunities for volume growth in expanding lower end market
Coatings Australia:market still buoyant but growth slowing 000 litres 35000 30000 25000 20000 15000 10000 5000 0 Jun 2000 Jun 2002 Jun 2003 Jun 2001 Dec 2000 Dec 2001 Dec 2002 Decorative coatings demand (quarterly total market)
3 months to June 03 MELLES GRIOT JDS UNIPHASE NEW FOCUS COHERENT NEWPORT Sales this quarter (US$m) 33.8 99.2 6.4 160.6 Change vs last year -7% -21% 3% -30% -28% Sales change on last qtr -1% 1% -4% 3% -3% Change best-current qtr -47% -58% -23% -84% -83% Book to bill, qtr 0.98 1.06 1.04 1.00 0.94 Book to bill, last 9 months 0.99 0.97 0.99 Scientific:Tough times continue in Melles Griot
Steel Tube:SA market impacted by steel price rise 140,000 120,000 100,000 80,000 60,000 40,000 20,000 0 2001 2002 2003 Barloworld SA domestic mild steel tube sales; October to July (tonnes) SA Steel Price Indexed (Oct 2000: 100)
Steel Tube:stainless exports margin squeeze 7000 6000 5000 Barloworld stainless exports (tonnes) October to July 4000 3000 2000 1000 0 2001 2002 2003
Tony Phillips CEO André Lamprecht HR and SA Public Sector Des Arnold Finance & Admin Mark Drewell Communication Lester Day Capital Equipment Southern Africa Dave Powell CIO Ramon Urrutia Capital Equipment Iberia Mike Coward Steel Tube Brandon Diamond Motor Ken Brown Industrial Distribution Peter Surgey Coatings Peter Maybury Scientific John Gomersall Cement & Lime Leadership renewal: the executive team in 2002
Des Arnold (retired) Tony Phillips CEO André Lamprecht Coatings & SA Public Sector Clive Thomson CFO Mark Drewell Communication Lester Day Capital Equipment Global Dave Powell CIO Peter Surgey HR, Risk & CSI Ramon Urrutia (retired) Brandon Diamond Industrial Distribution Martin Laubscher Motor ???? Scientific Mike Coward Steel Tube Ken Brown (retired) John Gomersall Strategic Planning, Logistics,Cement & Lime Peter Maybury (retired) Leadership renewal:the executive team in 2004
FY 2003 corporate activity update • SA Motor leasing book sold • April 2003 (R877 million) • NW Arkansas Freightliner dealer acquired • May 2003 (R49 million) • BEE transactions • Durban South Motors 50/50 JV, May 2003 (R2 billion turnover, R300 million net assets) • Afripack sale under way
2x4x4: growth goals on track • VBM-driven “quality of business” improvements • Expand existing and new business solutions and Smart Partnerships™ • Acquisitions • “More of the same” in new geographies • Add complementary brands
Growing value: moving and expanding “the CFROI bubble” 27.00 22.00 8% Internal hurdle rate 17.00 12.00 Real Asset Growth Rate 7.00 2.00 -3.00 6.0 6.5 7.0 7.5 8.0 8.5 9.0 -8.00 1999 2000 2001 2002
www.barloworld.com Mark Drewell Phone: +27 11 445 1204 E-mail: mdrewell@barloworld.com