Download
1 / 37
370 likes | 508 Vues
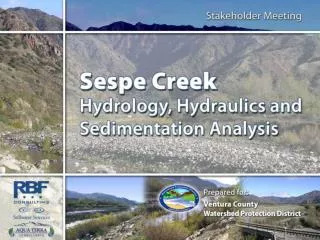
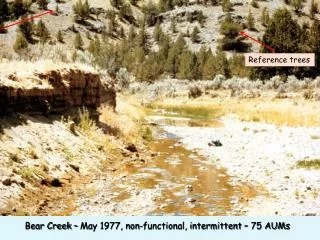
Reference trees. Bear Creek – May 1977, non-functional, intermittent – 75 AUMs. Bear Ck - July 2002 – after 25 years recovery, perennial trout stream. How did Bear Creek degrade? What changed?.

E N D
Reference trees Bear Creek – May 1977, non-functional, intermittent – 75 AUMs
Bear Ck - July 2002 – after 25 years recovery, perennial trout stream
How did Bear Creek degrade? What changed? Bear Creek was season long grazed for 100+ years. In the 1950’s the willows were sprayed to reduce water use and in 1964 there was a 100+ year event (rain on snow 12-24-64) and the stream downcut and widened out. The current livestock use was 25 cows/calves for three months (June, July, Aug) or 75 AUM’s. The vegetation is mostly upland species with some Baltic rush (dark green in center of picture). Uplands are dominated by basin big sagebrush and western juniper. Reference points are the plump juniper on the right and the snag on the left. The juniper in the foreground will be cut before the next photo was taken. The management was changed initially to two years of rest, followed by late winter (mid Feb) to early spring (mid April) grazing. Nothing was planted, this is natural recovery.
Stabilizing vegetation Slope angle Channel width What are some indicators that the stream is “ready” to recover?
Meander increasing Increase in riparian vegetation Channel narrowing Flood plain forming from trapped sediments Bear Creek May 1983 – 6 years – What is changing?
Flood plain both banks Bear Creek Aug 1986 – 9 years – changes continue in channel
Neb. Sedge, beaked sedge, spike rush, brook grass, three square bulrush, small-fruit bulrush, reed canarygrass Bear Creek Aug 1986 – 9 years – changes in riparian vegetation
Sediments stabilized as plants grow through deposits Channel narrows & deepens Bear Creek Aug 1987 – 10 years (2 months after flood receded.)
Bear Creek Oct 1988 – 11 years – perennial flow, flood plain storage
Rhizomes “chase” receding water, establishing root mats underneath channel and increasing amount of filtering vegetation and further narrowing channel. Bear Creek Aug 1993 – Role of drought
Bear Creek Nov 1995 – 18 years - loose beaver dam backs up water, storing more in late summer – washes out
Basin wildrye Bear Creek Feb 1996 – 18.5 yrs, 75 year flood event reaches uplands What will the impacts of this be?
Vegetation re-emerging in new sediment deposits - Bear Creek April 1996 – 18.7 yrs – beavers back at it
Bear Creek Oct 1996 – end of growing season after 75 year flood
Sediment caught near channel edge, helping to shape floodplain and adjust width:depth Bear Creek Sept 1997 – 20 years – moderate flow from thunderstorm
Stored water in banks regulates water temperatures both in summer and winter. Bear Creek Dec. 2000 – 23.5 yrs – thermal regulation in extended cold spell
Bear Ck - July 2002 – drought worsens, but what about creek and forage?
Bear Creek May 2004 – 27 years – flows still high (grazing complete)
Waterspout carried large sediment load down to Bear Ck, damming it about 300 yards below photo point. Bear Creek - July 2004 – Just when you think you have it figured out, nature plays a trick. Must consider uncertainty in planning. Bear Creek
Reference trees App. Photo point location Bear Creek April 2005 – photo point and reach now part of a “lake” and reed canarygrass dominates composition.
Bear Creek Aug 2006B Bear Cr. Aug. 2006
Item 9. Plant Communities that have Root Masses Capable of Withstanding High Streamflow Events
Grass Root Growth Response Defoliation Frequency Defoliation (shoot volume) Retardation Root Growth (Adapted from Briske 1991)
Difference in Air & Water Temperatures Bear Creek - Central Oregon 1976 100 80 Air 60 Water Difference 40 Temperature (Degrees F) 20 0 -20 -40 12-Aug 16-Aug 20-Aug 24-Aug 28-Aug 8-Aug Date
Difference in Air & Water Temperatures Bear Creek - Central Oregon 1998 120 Air 100 Water Difference 80 Temperature Degrees F 60 40 20 0 7-Aug 11-Aug 23-Aug 27-Aug 19-Aug 15-Aug 31-Aug Date
Bear Creek(3.5 Miles) Grazing 75 AUMs 250+ AUMs Data from C. Rasmussen (1996) and W. Elmore
Bear Creek : Change In Channel Profile (1977 – 2002) 1983 1977 2002 97 96 95 94 93 92 2002 91 1983 90 1977 89 88 100 105 110 115 120 125 130 135 140 145 150 155 160 165 170 175 180 185 190 195 200 205 210 215 220 225 230 235 240
General Recovery RatesNon-Functional beginning Every stream and reach is different in recovery based on soils, climate, vegetation, valley, etc. Remember uncertainty!