Download
1 / 5
50 likes | 172 Vues
Modeling Hydrodynamic Processes of Keluke Lake in the Tibetan Plateau Ying Liu*, Fang Wang Water Management and Hydrologic Science Department, Texas A&M University, College Station, TX 77843 *Email: rosalinea123@tamu.edu. Introduction. Model Configuration. Model Validation

E N D
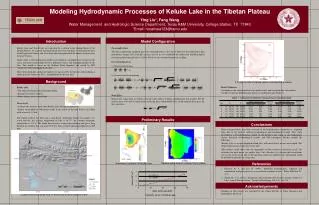
Modeling Hydrodynamic Processes of Keluke Lake in the Tibetan Plateau Ying Liu*, Fang WangWater Management and Hydrologic Science Department, Texas A&M University, College Station, TX 77843 *Email: rosalinea123@tamu.edu Introduction Model Configuration • Model Validation • According to the comparison between model results and measured data, the model is feasible to simulate hydrodynamic processes of Keluke Lake (Table 1). • Table 1. Comparison between measured and calculated data • There was previously very little research on the hydrodynamic simulation of highland lakes due to the lack of sufficient hydrological and topological records. This study developed a 2-D hydrodynamic model for the Keluke Lake, using in situ bathymetric survey, historical meteorological records, and GIS techniques. Results include the following: • Keluke Lake is an open highland inland lake, with more than 8 meters water depth. The deepest point locates in the west of the lake. • The model’s result shows that the magnitude of flow velocity is relatively small. The velocities for most nodes are smaller than 1 m/s. Besides, it is obvious that circulations exist at the center of the lake. If the upstream runoff was polluted, the contaminant could be detained in the lake for a long time. • Falconer, R. A. and Lin, B. (1999). "Modeling hydrodynamic, sediment and contaminant transport processes in coastal and estuarine waters." Water Pollution V1: 3-13 • Zhang, B., et al. (2011). "Estimation and trend detection of water storage at Nam Co Lake, central Tibetan Plateau." Journal of Hydrology 405(1-2): 161-170 • Funding for this project was provided by the China Institute of Water Resource and Hydropower Research Topographic Data The lake’s underwater landform data were obtained from in situ survey. Based on the bathymetric data measured in August 2012 with the accuracy of 0.01 m, we established the underwater landform digital elevation model with grid units of 100×100 m2 by the extended module of ArcMap. Governing Equations 1) Conservation of mass 2) Conservation of momentum: Wind Effect Wind exerts a drag force as it blows over the water surface. It plays a predominant role in lakes. For the surface shear stress due to wind action, resolving forces horizontally for a steady uniform flow gives for the x-direction: Keluke Lake and Tuosu Lake are connected by a stream in the Qaidam Basin of the Tibetan Plateau. As a closed small watershed, the ecosystem there is vulnerable because of the hyper-arid climate, and it has been affected significantly by human activities over the past 50 years. In this study, a 2-D mathematical model is developed as a foundation to research on the cause and effect relationships between pollutant sources and degrading quality of the lake. This model is based on the Shallow Water Equation and solved by ADI (Alternative Direction Implicit) method. Most of the field data used in the model were measured by the present authors during a field trip in the summer of 2012, and published for the first time. Background 2-D velocity field of Keluke Lake in a steady flow condition • Keluke Lake • The largest freshwater lake in Qaidam Basin. • Average elevation is 2800 m. • Water surface area is over 60 km2 . • Tuosu Lake • A saline lake receives water from Keluke Lake through Dalian River • Almost surrounded by Gobi desert while in the center of the lake there is an island with an area of 3.9 km2. • The region of these two lakes has a semi-desert continental climate. In summer it is warm and dry, the average temperature in July is 16.7ºC; the extreme maximum temperature is 33.1ºC. The whole basin receives strong solar radiation and gets a long duration of sunshine that can reach 3353 h/y. The averaged annual precipitation is 209 mm. • Location and hill-shading map of Keluke Lake basin based on DEM Preliminary Results Conclusions References Relative water level in a steady flow condition Underwater Landform of Keluke Lake Acknowledgements Capacity curve of Keluke Lake
This means only the “t” in “title” gets capitalized. • Results • The overall layout for this section can, and probably should, be modified from this template, depending on the size and number of charts and photographs your specific experiment generated. You might want a single, large column to accommodate a large map, or perhaps you could arrange 6 figures in a circle in the center of the poster: do whatever it takes to make your results graphically clear. To see examples of how others have abused this template to fit their presentation needs, perform a Google search for “powerpoint template for scientific posters.” • Paragraph format is fine, but sometimes a simple list of “bullet” points can communicate results more effectively: • 9 out of 12 brainectomized rats survived • Control rats completed maze faster, on average, than rats without brains (Fig. 3b) (t = 9.84, df = 21, p = 0.032) Conclusions You can, of course, start your conclusions in column #3 if your results section is “data light.” Conclusions should not be mere reminders of your results. Instead, you want to guide the reader through what you have concluded from the results. What is the broader significance? Would anyone be mildly surprised? Why should anyone care? This section should refer back, explicitly, to the “burning issue” mentioned in the introduction. If you didn’t mention a burning issue in the introduction, go back and fix that -- your poster should have made a good case for why this experiment was worthwhile. Blah, blah, blah. Blah, blah, blah. Blah, blah, blah. Blah, blah, blah. Blah, blah, blah. Blah, blah, blah. Blah, blah, blah. Blah, blah, blah. Blah, blah, blah. Blah, blah, blah. Blah, blah, blah. Blah, blah, blah. Blah, blah, blah. Blah, blah, blah. Blah, blah, blah. Blah, blah, blah. Blah, blah, blah. Blah, blah, blah. Blah, blah, blah. Blah, blah, blah. Blah, blah, blah. Blah, blah, blah. Blah, blah, blah. Blah, blah, blah. Blah, blah, blah. Blah, blah, blah. Blah, blah, blah. Blah, blah, blah. Blah, blah, blah. Blah, blah, blah. Blah, blah, blah. Make sure the edges of your columns are aligned with adjacent columns. Don’t trust your eyes: select the columns, then “Align” with the proper tool If you can orient your label horizontally, viewers with fused neck musculature are more likely to read it. Rats with brains navigate mazes faster Brainectomized Time (s) Control (brain intact) Maze difficulty index Figure 4. Avoid keys that force readers to labor through complicated graphs: just label all the lines (or bars) and then delete the silly key altogether. The above figure would also be greatly improved if I had the ability to draw mini rats with and without brains. I would then put these little illustrations next to the lines they represent. Be sure to separate figures from other figures by generous use of white space. When figures are too cramped, viewers get confused about which figures to read first and which legend goes with which figure. Figures are preferred but tables are sometimes unavoidable. A table looks best when it is first composed within Microsoft Word, then “Inserted” as an “Object.” If you can add small drawings or icons to your tables, do so! (b) (c) (a) Figure 3. Make sure legends have enough detail to fully explain to the viewer what the results are. Note that for posters it is good to put some “Materials and methods” information within the figure legends or onto the figures themselves—it allows the M&m section to be shorter, and gives viewer a sense of the experiment(s) even if they have skipped directly to figures. Don’t be tempted to reduce font size in figure legends, axes labels, etc.—your viewers are probably most interested in reading your figures and legends! Often you will have some more text-based results between your figures. This text should explicitly guide the reader through the figures. Blah, blah, blah (Figs. 3a,b). Blah, blah, blah. Blah, blah, blah. Blah, blah, blah. Blah, blah, blah. Blah, blah, blah. Blah, blah, blah. Blah, blah, blah. Blah, blah, blah (Fig. 3c). Blah, blah, blah. Blah, blah, blah. Blah, blah, blah. Blah, blah, blah. Blah, blah, blah. Blah, blah, blah. Blah, blah, blah. Blah, blah, blah (God, personal communication). Put a figure here that explores a statistical result This is the gene of interest! Figure 5. You can use connector lines and arrows to visually guide viewers through your results. Making logical points this way is much, much better than making it in the text section. These lines can help viewers read your poster even when you’re not present.
I sure wish I’d presented my theory with a poster before I wrote my book. • Objectives • As the primary pilot project for the Qinghai Province Lake and Ecology Programme, the specific objectives of the Delingha Catchment are to: • Measure and map the depths of Keluke Lake and Tuosu Lake, obtain capacity curves based on the information of lake depth and the surface area. • Develop a 2-D hydrodynamic model of Keluke Lake, simulate the change of salinity after the construction of an upstream dam. Predict the affect of construction on the aquatic ecosystem. Materials and methods Be brief, and opt for photographs or drawings whenever possible to illustrate organism, protocol, or experimental design. Viewers don’t actually want to read about the gruesome details, however fascinating you might find them. Blah, blah, blah. Blah, blah, blah. Blah, blah, blah. Blah, blah, blah. Blah, blah, blah. Blah, blah, blah. Blah, blah, blah. Blah, blah, blah. Blah, blah, blah. Blah, blah, blah Blah, blah, blah. Blah, blah, blah. Blah, blah, blah. Blah, blah, blah. Blah, blah, blah. Blah, blah, blah. This area is “white space” that adds tremendously to the readability of your poster. Resist the urge to fill it with text. Yea, this means you. Figure 1. Photograph or drawing of organism, chemical structure, procedure, etc. Don’t use graphics from the web (they look terrible when printed).
First column Topograpic Data The lake underwater landform data were obtained through measurements taken in the field. Based on the lake bathymetric survey data measure in August 2012 with the accuracy of 0.01 m and 65 measuring points, we established the underwater landform digital elevation model with grid units of 100×100 m2 by the extended module in ArcMap. Acknowledgments We thank I. Güor for laboratory assistance, Mary Juana for seeds, Herb Isside for applying the greenhouse stress treatment, and M.I. Menter for statistical advice and scintillating discussions. Funding for this project was provided by the Swarthmore College Department of Biology, a Merck summer stipend, and my mom. [Note that people’s titles are omitted.] Literature cited Bender, D.J., E.M Bayne, and R.M. Brigham. 1996. Lunar condition influences coyote (Canis latrans) howling. American Midland Naturalist 136:413-417. Brooks, L.D. 1988. The evolution of recombination rates. Pages 87-105 in The Evolution of Sex, edited by R.E. Michod and B.R. Levin. Sinauer, Sunderland, MA. Scott, E.C. 2005. Evolution vs. Creationism: an Introduction. University of California Press, Berkeley. Society for the Study of Evolution. 2005. Statement on teaching evolution. <http://www.evolutionsociety.org/statements.html>. Accessed 2005 Aug 9. For further information Please contact email@swarthmore.edu. More information on this and related projects can be obtained at www.swarthmore… (give the URL for general laboratory web site). A link to an online, PDF-version of the poster is nice, too. Start your second column of citations here. Remember: no period after journal name. Really!