
Linear Correlation in Data Analysis
E N D
Presentation Transcript
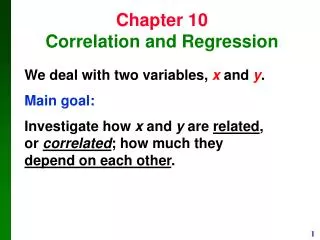
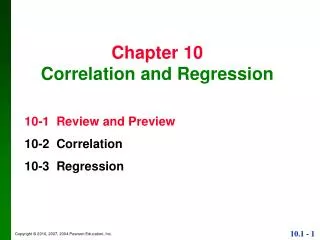
10-2 Correlation A correlation exists between two variables when the values of one are somehow associated with the values of the other in some way. A linear correlation exists between two variables when there is a correlation and the plotted points of paired data result in a pattern that can be approximated by a straight line.
Exploring the Data We can often see a relationship between two variables by constructing a scatterplot. The following slides show scatterplots with different characteristics.
Formula The linear correlation coefficientr measures the strength of a linear relationship between the paired values in a sample. Here are two formulas: Technology can (and should…we will NOT do any of these by hand ) compute this.
Common Errors Involving Correlation 1. Causation: It is wrong to conclude that correlation implies causality. 2. Averages: Averages suppress individual variation and may inflate the correlation coefficient. 3. Linearity: There may be some relationship between x and y even when there is no linear correlation.
Example The paired shoe / height data from five males are listed below. Use a computer or a calculator to find the value of the correlation coefficient r.
Example - Continued Requirement Check: The data are a simple random sample of quantitative data, the plotted points appear to roughly approximate a straight-line pattern, and there are no outliers.
Example - Continued A few technologies are displayed below, used to calculate the value of r.
Is There a Linear Correlation? We found previously for the shoe and height example that r = 0.591. We now proceed to interpret its meaning. Our goal is to decide whether or not there appears to be a linear correlation between shoe print lengths and heights of people.
Formal Hypothesis Test We wish to determine whether there is a significant linear correlation between two variables. Notation: n = number of pairs of sample data r = linear correlation coefficient for a sample of paired data ρ = linear correlation coefficient for a population of paired data
Hypothesis Test for CorrelationHypotheses Test Statistic: r
P-Value Method for a Hypothesis Test for Linear Correlation The test statistic is below, use n – 2 degrees of freedom. P-values can be found using software or Table A-3.
Example Continuing the same example, we calculate the test statistic: Table A-3 shows this test statistic yields a P-value that is greater than 0.20. Technology provides the P-value as 0.2937.
Example - Continued Because the P-value of 0.2937 is greater than the significance level of 0.05, we fail to reject the null hypothesis. We conclude there is not sufficient evidence to support the claim of a linear correlation between shoe print length and heights.
One-Tailed Tests One-tailed tests can occur with a claim of a positive linear correlation or a claim of a negative linear correlation. In such cases, the hypotheses will be as shown here. For these one-tailed tests, the P-value method can be used as in earlier chapters.