http://antoine.frostburg.edu/chem/senese/101/matter/slides/sld006.htm
120 likes | 1.2k Vues
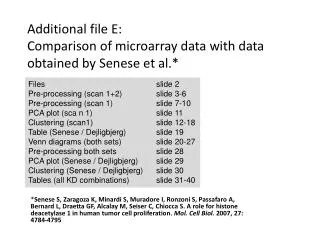
http://antoine.frostburg.edu/chem/senese/101/matter/slides/sld006.htm. http://antoine.frostburg.edu/chem/senese/101/matter/slides/sld008.htm. Distribution Constant . Equilibrium constant Also called the partition coefficient K

http://antoine.frostburg.edu/chem/senese/101/matter/slides/sld006.htm
E N D
Presentation Transcript
http://antoine.frostburg.edu/chem/senese/101/matter/slides/sld006.htmhttp://antoine.frostburg.edu/chem/senese/101/matter/slides/sld006.htm
http://antoine.frostburg.edu/chem/senese/101/matter/slides/sld008.htmhttp://antoine.frostburg.edu/chem/senese/101/matter/slides/sld008.htm
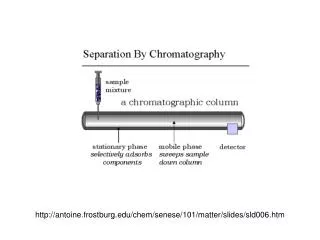
Distribution Constant • Equilibrium constant • Also called the partition coefficient • K • K = [A]s/[A]m (the ratio of the concentration of a component in the stationary phase to the concentration of that component in the mobile phase)
Selectivity Factor • α (alpha) • Alpha is a measure of how well two components in a mixture will separate • α = KB/KA • By definition, component B is the component with a higher K ; therefore B prefers the stationary phase over A and will be eluted with a longer retention time. Due to this α will always be greater than 1
http://antoine.frostburg.edu/chem/senese/101/matter/slides/sld009.htmhttp://antoine.frostburg.edu/chem/senese/101/matter/slides/sld009.htm
http://www.unsolvedmysteries.oregonstate.edu/GCMS_05.shtml http://www.shsu.edu/%7Echm_tgc/sounds/GC-MS.mov
Electron Ionization • Molecule + e- molecule+ + 2e- • Four electromagnetic poles • Rapidly oscillating field • If mass of ion and frequency of oscillation are comparable then the ion will oscillate towards the detector and be measured • A certain mass range can be selected depending on the pole diameter Quadropole Detector
20 particles 10 ion - + e- Secondary Ion Mass Spectrometry Ga+ Static SIMS = < 1 x 10¹³ ions/cm2
Time-of-Flight Detection Scheme d -V +V M+ MCP detector Field Free Region Sample e = charge on an electron 1.6 x 10⁻¹⁹ C t = time for ion to reach detector m = mass v = velocity V = stage voltage d = length of field free region V = voltage of detector
TOF-SIMS Molecule-Specific Imaging total ion image Ag+ Intensity Ion Gun y x 570 µm x 570 µm m/z, +ions molecule-specific image Si+ Ag+ Cu+ Si+ Cu+ copper grid affixed to silicon substrate with silver paste
TOF-SIMS Identification of Plasma Membrane Lipids + - * * +2H m/z 552 m/z 184 cholesterol m/z 369 m/z 385 (M-H)+ DPPC – dipalmitoylphosphatidylcholine m/z 735 (M+H)+
DPPC (M+H)+ cholesterol DPPC tailgroup cholesterol + +2H PC m/z 552 m/z 184 - cholesterol DPPC molecular ion m/z 385 molecular ion m/z 735 m/z 369 (M-OH)+ TOF-SIMS Allows for Chemical Identification of Lipid Domains Au 370 µm x 370 µm A. G. Sostarecz; C. M. McQuaw et. al. J. Am. Chem. Soc.2004.