Download
1 / 9
90 likes | 180 Vues
Learn the rules of creating accurate and organized charts with examples using fish lengths and plant growth data. Understand the importance of titles, defined columns and rows, filled-in data cells, and proper units in data presentation. Follow along to ensure clear and effective data visualization.

E N D
Rules of Charts By Steve Harris and Mark Totten 10/31/2014
RadishRaphanus sativus • an edibleroot vegetable of the Brassicaceae family that was domesticated in Europe,
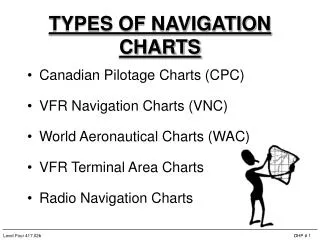
Possible Brassica Rapa Seed Types • Standard • Elongated Internodes • Anthocyaninless • Anthocyaninless Yellow-Green • Rosette • Yellow-Green Leaf • Cytoplasmic Variegated • Petite
Rules of Charts • Name, Date & Hour • All charts must have a Two partTITLE. • Must use a Ruler. • All COLUMNS must be DEFINED. • All ROWS must be DEFINED. • All DATA cells FILLED IN. • All DATA must be followed by UNITS. (no naked numbers)
Name, Date, Hour Chart1: Lengths of study fish in Aquaculture fish tank A+ • Time in Fish 1 Fish 2 Fish 3 Fish 4 Fish 5 • Weeks Length Length Length Length Length • Week 5 25 cm. 30 cm. 50 cm. 34 cm. 78 cm. • Week 6 26 cm. 31 cm. 51 cm. 35 cm. 79 cm. • Week 7 27 cm. 32 cm. 52 cm. 36 cm. 80 cm. • Week 8 28 cm. Na 53 cm. 37 cm. 81 cm. • Week 9 29 cm. 34 cm. 54 cm. 38 cm. 82 cm. • Week 10 30 cm. 35 cm. 55 cm. 39 cm. 83 cm. • Week 11 31 cm. 36 cm. 56 cm. Died 84 cm. • Week 12 32 cm. 37 cm. 57 cm. Died 85 cm. • Week 13 33 cm. 38 cm. 58 cm. Died 86 cm.
Organize the following data into a data chart. Once a week, each Friday, for five consecutive weeks, students in 7th hour biology class assisted in the measurements of three recently hatched chick. “Green Wing”: 20g, 40g, 80g,240g and 720g each week. “Princess”: 70g, 150g, 300g, 600g and 1,500g each week. “Jimmy the Rooster”: 150g, 300g, 700g, 1,250g and 2,430g.
N.D.H Chart 1: Growth of Brasica rappa Time in Days Plant 1 Plant 2 Plant 3 Plant 4 Plant 5 Plant 6 Average 0 Day 1st. Day 2nd. Day 3rd. Day 4th. Day 5th. Day 6th. Day 7th. Day 8th. Day 9th. Day 10th. Day 11th. Day 12th. Day 13th. Day 14th. Day 15th. Day