Download
1 / 48
490 likes | 547 Vues
Explore the advantages of linear motors over pneumatic systems for enhanced process stability, installation flexibility, and energy efficiency. This innovative solution offers simple setup, lower maintenance costs, and higher productivity. Learn about energy costs, system comparisons, and long-term savings in logistic and installation expenses.

E N D
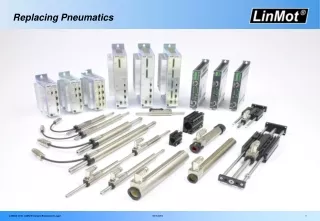
Simple solution Flexibility Dynamics Duration Process stability Installation & setup Energy & service costs Perspectives for the future Advantages of Linear Motors
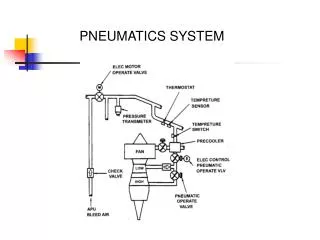
System comparison: Pneumatic - Linear Motor Limit Switches Cable Cable Damper Piston Fittings Cable Reduction Valves Tubes Solenoid Valve Noise Filter Even more simple than pneumatics ... Savings in logistic- and installation costs Cable Linear Motor Drive
Flexibility: Free Positioning + Higher Flexibility … Savings in setup and product changeover costs Simple programming over Teach-In
Programmable, constante and Production stability & monitoring monitored motions… lower product waste costs Flexibility, Process Stability and Reliability Air Cylinder: - with air damping (1) - standard cylinder (2) Linear motors: free programmable velocity, accelerationforce, motion profiles with monitoring
Higher Productivity Last Position-time diagram for a LinMot Linear Modul H01-37x240 Compared to a pneumatic system with soft stop D=25mm D 600 8,0 kg 6,0 kg 500 4,0 kg 2,0 kg 0,0 kg 400 PSS 8.0 kg (max.) PSS 8.0 kg (min.) 300 200 100 0 0 50 100 150 200 250 300 Hub [mm] High dynamic & Higher productivity & Short positioning times lower production costs
Lower maintenance costs: Life Expectancy LinMot: Pneumatic: Years Months Higher economic life-time Savings in service and maintenance costs
Efficiency & Energy Costs Analyzing linear motionswith 6-600 cycles/min
15kg 15kg Application example with 30 cycles/minute 30 cycles per minute with 500ms motion time and 500msec standstill time v [m/s] a [m/s²] 400mm Forward motion 400mm 500msec Standstill time 500msec Backward motion - 400mm 500msec Standstill time 500msec Total cycle time 2‘000msec
Application example with 30 cycles/minute Motion Sequence Position over Time Acceleration Deceleration Deceleration Acceleration Required Motor Force
Ideal Linear Motion: Power & Energy Power Losses Pv = I2*R Power Servo Controllers with DC Link Capacitors Power Acceleration Deceleration Deceleration Acceleration
Motor Sizing with LinMot Designer Vmax = 1m/s Motor Power < 100W Energy Costs: 100W x 8‘000h = 800kWh800kWh x 0.12 EUR = 96.- EUR
Power measurement with linear motor 30 cycles/minute, load 15kg, stroke 400mm: Measured nominal power: 92W
Pneumatics: Power, Energy & Losses Losses Power Losses Power Compressor Power Motion Motion
100% Power 10% Motor Losses 25% Compressor Losses 20% Start- Stop Losses 5% Air Treatment Losses 20% Pressure Losses, Reduction Valves 5% Leakage 5% Transformation Losses 5% Power at the Pneumatic Tool/Cylinder Pneumatics: Energy Efficiency
Pneumatics: Cylinder sizing The minimal required velocity in this application to move 400mm forward within 500msec is 1m/s. The pneumatic cylinder required to move 15kg payload with a speed of 1m/s has a minimal diameter of 50mm.
Air consumption Air consumption at 30 cycles per minute with air cylinder d=50mm, stroke 400mmper cycle: 400mm x 0.02529dm3/mm = 10.37dm3per minute: 30 Takte/Minute x 10.37dm3 = 311.35dm3 = 0.311m3per hour: 0.311m3 x 60 Minuten = 18.68m3 Per year: 18.68m3 x 8‘000h = 150‘000 Nm3 Quelle: IMI Nogren
Energy required for compressed air production Motor Power: 750 kW Air Flow: 125 Nm3/min 7‘500 Nm3/h El. Energy 750 kWh .per Volume: 7‘500 Nm3/h = 0.10 kWh/Nm3 The compressors energy consumption to produce 1m3 compressed air at 6 Bar, is around 0.60 kWh. In an optimal process, 0.100kWh elektric energy is needed to compress 1Nm3 air to a pressure of 6 bar.
Compressed Air: Losses 100% Power Compressor Start-and Stop losses: 25% ... 35% Pressure Losses,Reduction ValvesLeakage Losses 20% ...25% 10% Motor Losses 25% Compressor Losses 20% Start- Stop Losses To compress 1Nm3to 6 barthe compressorconsumes0.130 kWhelectrical energy. 5% Air Treatment Losses 20% Pressure Losses, Red. Valves 5% Leakage 5% Transformation Losses 5% Power at the Pneumatic Tool/Cylinder Air consumption profile Including these losses in our example, more than 190‘000Nm3 airmust be compressed to 6 bar. Additional Energy Losses Quelle: Atlas Copco
Compressed Air: Specific Power 0.12-0.16kWh/Nm3 Anlayse dreier Projektpartner Druckluft Effizient Studie, Dr.-Ing. Peter RadgenFraunhofer Institut Systemtechnik und Innovationsforschung (ISI), Karlsruhe
Compressed Air: Average leakage 20…25% Druckluft Effizient, Abschlussbericht 2005
Pneumatic: Losses due to Leakage Reference Conditions: 7 bar; Energy Costs 0,12 Euro/kWh, 8.000 operating hours / year Quelle: Atlas Copco Average losses due to leakage in air distribution 20…25%
Energy Costs EUROSTAT Electric Energy Costs for Industrial Customers (high volume >24GWh) incl. Taxes
Energy Costs Air Cylinder Air consumption: 190‘000 Nm3 Energy requirement: 0.130 kWh/m3 - Energy consumption: 25‘000kWh- Nominal power: > 3‘000 W Energy price: 0.12 EUR/kWh Energy costs: 3‘000.00 EUR Energy costs to move 15kg with 30 cyclesper minute with a stroke of 400mm: 3‘000.- EUR per year!
Full cost calculation I Investment cost: 10 - 15% Maintenance cost: 10 - 15% Energy costs: 70 - 80% Annual air costs per cylinder: 3‘000.- EUR / 0.80 = 3‘750.- EUR Quelle: www.druckluft.ch The air costs including investment and maintenance costs forthe compressor are around 3‘750.- EUR per cylinder and year!
Full cost calculation II Pneumatic component manufacturerscalculate with the following productioncosts for pressured air: 0.025 EUR/Nm3 Quelle: Festo Broschüre „Energy Saving Services“ Stand 2010/08 Annual air cost per cylinder:150‘000 Nm3 x 0.025 EUR/Nm3 = 3‘750.- EUR Also according pneumatic component manufacturers the air costsin this application are around 3‘750.- EUR per cylinder and year!
Return of Investment TCO after 24 months: Air Cylinder: 7‘540.- EURLinear Motor: 1‘640.- EUR TCO after 12 months: Air Cylinder: 3‘840.- EURLinear Motor: 1‘540.- EUR Savings5‘900.- EUR TCO after 5 months: Air Cylinder: 1‘480.- EURLinear Motor: 1‘480.- EURSavings: 0.- EUR Savings2‘300.- EUR Start 5 months 12 months 12 months Higher investment costs are paid off already after 5 months of operation!
CO2 - Emission Quelle: Fraunhofer Institut (D)
CO2 – Emission: Energy mix Germany Calculationenergy mix in Germany: Nuclearplants: 25’000kWh x 0.22 x 32g/kWh 176 kgBrown coal: 25’000kWh x 0.22 x 1153g/kWh 6’341 kgStowncoal: 25’000kWh x 0.18 x 949g/kWh 4’270 kgGas: 25’000kWh x 0.13 x 428g/kWh 1’391 kgRenewable: 25’000kWh x 0.14 x 25g/kWh 87 kgOthers: ? ? http://www.co2-emissionen-vergleichen.de CO2 – Emission in Germany: 12,5 tons of CO2 per year and cylinder !!!
CO2 – Emission per cylinder Pneumatic cylinderweigth: 3 kg AnnualCO2 – Emmissionover 12’500 kg
CO2 -Emission Run the pneumatic cylinder for 1 year ... ...or drive with your car around the world ... 3.3 - 6 times around the world!!! 0.6 ... 1 timesaround the world!
Perspectives: CO2 -Emission Quelle: Siemens Pressebilder 07/2012 CO2 –Emission pro Zylinder 2011: 12,9t CO2 pro Zylinder/Jahr 2030: 11,5t CO2 pro Zylinder/Jahr
Perspectives: Efficiency Electric Power [kW] per [Nm3/min] Bad Zone Good Zone Physical Limit Compressed air pressure [bar] Energy consumption of 0.100 kWh/Nm3equals 6kW/(Nm3/min) and is a valueclose to the physical limit (yellow zone) Quelle: Bundesamt für Energie
Perspectives: Rising costs for electric energy EUROSTAT Electric Energy Costs for Industrial Customers (high volume >24GWh) +??% +40% +33% Since 2004 the costs for electric energyalmost doubled within a seven years.
Perspectives: Increasing productivity 400mm in 270msec Vmax = 2.33m/s Energy Costs: 200W x 8‘000h = 1‘600kWh1‘600kWh x 0.12 EUR = 192.- EUR Motor Power < 200W
Perspectives: Aditional functionallity Precise and Dynamic Force Control with down to 0.1N Force Resolution. Closed Loop Control with external force transducer.
Perspectives: Innovation Machine builder: Top 10 countriesSales volume without service, installation, repair Permanent innovation helps to become and to stay a market leader!
Application Example: P&P Handling Module Pneumatic Pick & Place Linear Motor Pick & Place
Application Example: P&P Handling Module Pneumatic Linear Motor Introduction 1997 2008 Sales Price 100% 130% Sales in 2008 100% 0% Sales in 2010 40% 60%
Simple solution Flexibility Dynamics Duration Process stability Installation & setup Energy & service costs Perspectives for the future Advantages Linear Motor
15kg 15kg Pneumatic Cylinder Size 30 cycles per minute with 500ms motion time and 500msec standstill time v [m/s] a [m/s²] 400mm Supplier 1&2 Supplier 3&4 Supplier 5 D >= 50mm D = 40/32mm D = 32/25mm
Pneumatic Cylinder Size Supplier 1&2 Supplier 3&4 Supplier 5 D >= 50mm D = 40/(32)mm D = 32/(25)mm P eff >= 3’000W P eff = 2’000W (1’250W) P eff = 1’250W (750W) Power/Energy consumption compared to a linear motor (P eff = 100W) x30 times 3’000% x20 (12.5) times 2’000% x12.5 (7.5) times 1’250%
Efficiency laws for rotary motors ! Banned ! From 2011 rotary motors must correspond to efficiency class IE2. From 2015 rotary motors >375kW must correspond to efficiency class IE3, or IE2 with FC. From 2017 rotary motors <375kW must correspond to efficiency class IE3, or IE2 with FC.
Efficiency laws for rotary motors Efficiency Motor Power New law for savings of 2…20% «only»