Analytics-Based Crime Prediction
As per studies conducted by the University of California, it is observed that crime in any area follows the same pattern as that of earthquake aftershocks. It is difficult to predict an earthquake, but once it happens the aftershocks following it are quite predictable. Same is true for the crimes happening in a geographical area.


Analytics-Based Crime Prediction
E N D
Presentation Transcript
Analytics-Based Crime Prediction Moving From Reactive to Proactive Policing
A US city uses predictive analytics to reduce burglaries by 30% After using predictive analytical tools , the date & time of next burglary for 17 stores for next 15 days was predicted. It was also found that 13 stores out of 21 belonged to one specific retail chain. This helped in effective deployment of resources ahead of crime, resulting in moving from ‘what happened’ to ‘what will happen’ and changing the outcomes. In one of the US tier II cities, 200 burglary cases were reported in 2 years Through hot spot analysis it is found that entire east side of the city is a burglary hot spot. Further analysis shows that the targets have been departmental stores, gas stations, retail chains, mini marts, etc. Further analysis showed that specifically 21 stores were targeted more than 130 times. Copyright © 2017 Prodapt Solutions. All Rights Reserved. Confidential & Restricted
What makes crime predictable? As per studies conducted by the University of California, it is observed that crime in any area follows the same pattern as that of earthquake aftershocks. It is difficult to predict an earthquake, but once it happens the aftershocks following it are quite predictable. Same is true for the crimes happening in a geographical area. On behavioral grounds, it has been found that once successful, criminals try to replicate the crime under similar conditions. They tend to operate in their comfort zone, and hence, they look for similar location and time for the next crime. This makes them predictable. In the words of Charlie Beck, Chief of the Los Angeles Police Department, “The predictive vision moves law enforcement from focusing on what happened to focusing on what will happen and how to effectively deploy resources in front of crime, thereby changing outcomes.” Copyright © 2017 Prodapt Solutions. All Rights Reserved. Confidential & Restricted
Predicting crime by applying analytics on data feeds from various sources Predictive Intelligenc e Crime Predictio n Crime Big Data - Mathematical models - Machine learning algorithms - Historical data, Public transit maps etc., - Connected devices, body cameras, facial recognition, sensor networks, etc. - Social media, CCTV - Predictive policing Predictive policing, in essence, is taking data from disparate sources, analyzing them and then using results to anticipate, prevent and respond more effectively to future crime. Crime prediction completely relies on huge amounts of data – historical data, data coming from CCTVs, social media conversations, weather reports, population data, public events data, economic growth related data, etc. This data is then analyzed through complex mathematical models, predictive analytics technique and machine learning algorithms to identify patterns of crime which can’t be seen by humans. The collected data is pre-processed and analyzed to identify the hidden patterns and correlation between crime type and locations are derived. Predictive Models are built using machine learning algorithms to predict the future crime occurrences Copyright © 2017 Prodapt Solutions. All Rights Reserved. Confidential & Restricted
Conversion of data to prediction and its impact Data Collection Analysis Analytical techniques like hot spot analysis, data mining, regression, spatiotemporal methods, risk-terrain analysis are used for predicting various categories of crime Data should be collected from various sources. The accuracy of predictions depends on completeness and accuracy of this data. The various sources can be historical police records, public maps, CCTV, social media, body worn cameras, etc. Criminal Response Police Operations Correct intervention technique needs to be planned to act on the predictions. These techniques can be generic, crime-specific or problem-specific As a result of better police interventions criminals can be arrested, crimes stopped, and their location or techniques changed. Under any circumstance, the original data set is rendered obsolete and fresh one is needed, thus starting the cycle from step one. Data Fusion - A lot of external environmental factors influence the act of crime and these may or may not be collected by police depts. These data sets are usually on businesses, infrastructure and demographics. Taking into consideration these disparate data sets during analysis can give more precise predictions Copyright © 2017 Prodapt Solutions. All Rights Reserved. Confidential & Restricted
Analytical techniques to predict “where, when and what” of crime It is crucial to identify where the crime will happen, what will happen and when. The below matrix would help you in choosing the right analytical technique for the required function. KEY CONSIDERATIONS SVM(Support Vector Machine) performs better for Binary classification problems rather than multiclass classification. Random Forest Classification and Gradient Boosting Machine gives better results for Multi-Class Multi-Label classification problems. For huge datasets with data that can be grouped by a specific category (e.g., areas in a state) and more output labels to be predicted (e.g., list of hotspots in the entire state), it is recommended to use split and combine approach (build smaller models and combine the predicted results) for higher efficiency. Technique Where What When Random Forrest Gradient Boosting Machine Hot Spot Analysis Time Series Near-Repeat Methods Statistical Regression Risk-Terrain Analysis Spatiotemporal Machine Learning vs. Rule-Based Engines - Machine Learning builds intelligence from various sources of data and its output. ML algorithms tries to mimic human intelligence with minimal intervention. This intelligence gets upgraded over time as new or additional data is made available. The ML Algorithm automatically adjusts the parameters to check for pattern change with new data. - With rule based engine solutions, rules have to be updated frequently which increases manual intervention. Also, with increasing data, rule engine becomes heavy and maintenance becomes difficult. Copyright © 2017 Prodapt Solutions. All Rights Reserved. Confidential & Restricted
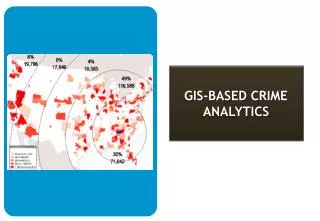
Using multi-label classification techniques and time series analysis to predict location, category and time of crime Hot spot analysis helped in creating crime heat map which showed that the central and eastern parts are more crime-prone. In one of the US tier I cities, the number of crimes reported over past 5 years is close to 1.5 million. This data is pre-processed and initial patterns are identified pertaining to every district. The city is divided in to 23 districts and every district is sub-divided into various wards. Initial findings such as most crime prone ward, most popular crime in any ward etc. are found out at this stage. Property-related crimes Burglaries 25% Identifying the “when” of crime Multi-label techniques like “Gradient boosting,” “Random forest,” etc. identified which crime can happen in each of the subsequent wards of the 23 districts 30% With the prediction accuracy of 60-74% and appropriate intervention techniques, approximate reduction of 30% in burglaries and 20-25% in property related crimes can be achieved. Time series analysis of the same 5 years of data gave probable time of occurrence of crimes identified in previous step. Identifying the “what” and “where” of crime Copyright © 2017 Prodapt Solutions. All Rights Reserved. Confidential & Restricted
Key takeaways Accuracy of 60-74%can be achieved in predicting category of crime by multi-label classification techniques like “gradient boosting machine” and “random forest.” In Richmond, crime prediction decreased random gunfire by 47% and saved $15000 in personal costs on New Year’s Eve. Weapons seize also increased by 246%. Los Angeles saw 33% reduction in burglaries, 21% reduction in violent crimes and 12% reduction in property crimes as a result of predictive policing. As a result of crime prediction, Alhambra reported 32% drop in burglaries and 20% drop in vehicle theft over a period of 15 months. Crime prediction accuracy of 65-72% can be achieved by analyzing just 4-5 years of crime data. Including feeds coming from social media, accuracy of prediction can be increased by up to 15%. Copyright © 2017 Prodapt Solutions. All Rights Reserved. Confidential & Restricted
Credits • • • Avaiarasi S, Director - Delivery (IoT) Kamakya C, Project Manager - IoT Sarvagya Nayak, Business Analyst - Insights Copyright © 2017 Prodapt Solutions. All Rights Reserved. 9 Confidential & Restricted
Amsterdam London New York THANK YOU! Tualatin Dallas Bengaluru Chennai Johannesburg INDIA USA THE NETHERLANDS SOUTH AFRICA UK Prodapt (UK) Limited Reading: Davidson House, The Forbury, Reading RG1 3EU Ph: +44 (0) 11 8900 1068 Prodapt Solutions Pvt. Ltd. Prodapt North America Tualatin: 7565 SW Mohawk St., Ph: +1 503 636 3737 Prodapt Solutions Europe Amsterdam: Zekeringstraat 17A, 1014 BM Ph: +31 (0) 20 4895711 Prodapt SA (Pty) Ltd. Johannesburg: No. 3, 3rd Avenue, Rivonia Ph: +27 (0) 11 259 4000 Chennai: 1. Prince Infocity II, OMR Ph: +91 44 4903 3000 Dallas: 222 W. Las Colinas Blvd., Irving Ph: +1 972 201 9009 Prodapt Consulting BV Rijswijk: De Bruyn Kopsstraat 14 Ph: +31 (0) 70 4140722 2. “Chennai One” SEZ, Thoraipakkam Ph: +91 44 4230 2300 New York: 1 Bridge Street, Irvington Ph: +1 646 403 8158 Bangalore: “CareerNet Campus” No. 53, Devarabisana Halli, Outer Ring Road