Advanced Image Segmentation Techniques for Region Segmentation and Graph Theoretical Analysis
This text delves into region segmentation using K-Means algorithm, clustering based on color, intensity clusters, finding optimal K value, and split and merge techniques. Moreover, it discusses graph theory concepts for image segmentation like graph representations, minimum cut, and normalized cuts.

Advanced Image Segmentation Techniques for Region Segmentation and Graph Theoretical Analysis
E N D
Presentation Transcript
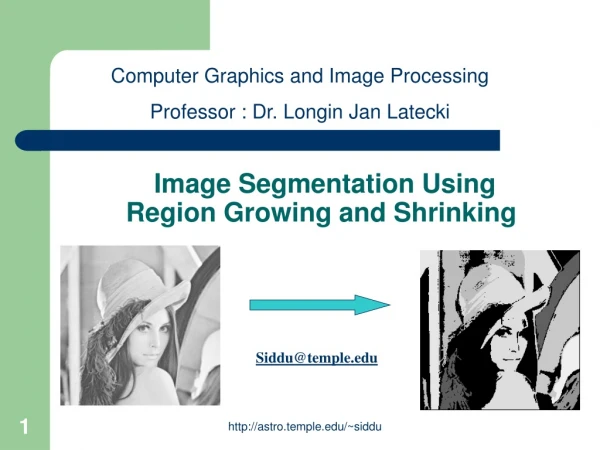
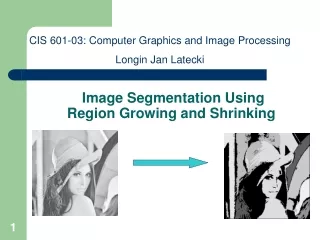
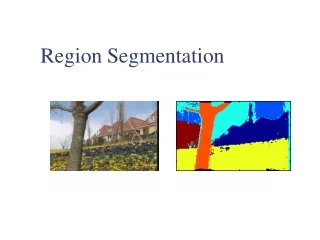
Region Segmentation • Find sets of pixels, such that • All pixels in region i satisfy some constraint of similarity.
Choose a fixed number of clusters Choose cluster centers and point-cluster allocations to minimize error can’t do this by search, because there are too many possible allocations. Algorithm fix cluster centers; allocate points to closest cluster fix allocation; compute best cluster centers x could be any set of features for which we can compute a distance (careful about scaling) K-Means
Image Segmentation by K-Means • Select a value of K • Select a feature vector for every pixel (color, texture, position, or combination of these etc.) • Define a similarity measure between feature vectors (Usually Euclidean Distance). • Apply K-Means Algorithm. • Apply Connected Components Algorithm. • Merge any components of size less than some threshold to an adjacent component that is most similar to it.
Image Clusters on intensity Clusters on color K-means clustering using intensity alone and color alone
Image Clusters on color K-means using color alone, 11 segments
K-means using color alone, 11 segments.
K-means using colour and position, 20 segments
How to find K • Use prior knowledge about image. • Apply the algorithm for different values of K and test for goodness of clusters. • Analyze Image Histograms.
How to Find K Realistic Histograms
How to Find K Smooth Histogram. (Convolve by averaging or Gaussian Filter)
How to Find K Find Peaks and Valleys and perform peakiness test.
Assume that each cluster is single pixel (i.e. every pixel is a cluster itself). Merge Clusters i.e. attach closest to cluster it is closest to (if possible) Repeat step 2 until no more clusters can be merged. Agglomerative clustering
Assume that whole image is a single cluster. Split Clusters along best boundary (if exists) Repeat step 2 until no more clusters can be split. Divisive clustering
single-link clustering: Minimum distance between an element of the first cluster and one of the second.. complete-link clustering: Maximum distance between an element of the first cluster and one of the second. group-average clustering: Average of distances between elements in the clusters. Inter-Cluster distance
Start with an initial segmentation (for example by K-Means). Define a criteria P for goodness of region such that P( R )=True, if R satisfies the criteria P( R )=False, otherwise For each region R, split R in four regions (quadrants), if P( R ) = False Merge any two adjacent regions R and Qif Repeat until no more clusters can be split or merged. Segmentation by Split and Merge
Graph • A graph G(V,E) is a triple consisting of a vertex set V(G) an edge set E(G) and a relation that associates with each edge two vertices called its end points.
Path • A path is a sequence of edges e1, e2, e3, … en. Such that each (for each i>2 & i<n) edge ei is adjacent to e(i+1) and e(i-1). e1 is only adjacent to e2 and en is only adjacent to e(n-1)
Connected & Disconnected Graph • A graph G is connected if there is a path from every vertex to every other vertex in G. • A graph G that is not connected is called disconnected graph.
Graphs Representations a b c e d Adjacency Matrix: W
Weighted Graphs and Their Representations a b c e 6 d Weight Matrix: W
Minimum Cut A cut of a graph G is the set of edges S such that removal of S from G disconnects G. Minimum cut is the cut of minimum weight, where weight of cut <A,B> is given as
Image Segmentation & Minimum Cut Pixel Neighborhood w Image Pixels Similarity Measure Minimum Cut
Minimum Cut • There can be more than one minimum cut in a given graph • All minimum cuts of a graph can be found in polynomial time1. 1H. Nagamochi, K. Nishimura and T. Ibaraki, “Computing all small cuts in an undirected network. SIAM J. Discrete Math. 10 (1997) 469-481.
Drawbacks of Minimum Cut • Weight of cut is directly proportional to the number of edges in the cut. Cuts with lesser weight than the ideal cut Ideal Cut
Normalized Cuts1 • Normalized cut is defined as • Ncut(A,B) is the measure of dissimilarity of sets A and B. • Minimizing Ncut(A,B) maximizes a measure of similarity within the sets A and B 1J. Shi and J. Malik, “Normalized Cuts & Image Segmentation,” IEEE Trans. of PAMI, Aug 2000.
Finding Minimum Normalized-Cut • Finding the Minimum Normalized-Cut is NP-Hard. • Polynomial Approximations are generally used for segmentation
Finding Minimum Normalized-Cut Pixel Neighborhood 1 2 3 w Image Pixels Similarity Measure n n-1
Finding Minimum Normalized-Cut • It can be shown that such that • If y is allowed to take real values then the minimization can be done by solving the generalized eigenvalue system
Algorithm • Compute matrices W & D • Solve for eigen vectors with the smallest eigen values • Use the eigen vector with second smallest eigen value to bipartition the graph • Recursively partition the segmented parts if necessary.
Figure from “Image and video segmentation: the normalised cut framework”, by Shi and Malik, 1998
F igure from “Normalized cuts and image segmentation,” Shi and Malik, 2000
Drawbacks of Minimum Normalized Cut • Huge Storage Requirement and time complexity • Bias towards partitioning into equal segments • Have problems with textured backgrounds
Suggested Reading • Chapter 14, David A. Forsyth and Jean Ponce, “Computer Vision: A Modern Approach”. • Jianbo Shi, Jitendra Malik, “Normalized Cuts and Image Segmentation,” IEEE Transactions on Pattern Analysis and Machine Intelligence, 1997 • Chapter 3, Mubarak Shah, “Fundamentals of Computer Vision”