Download
1 / 23
280 likes | 841 Vues
Learn about principal stresses in beams, stress trajectories, and how to analyze and predict stress distribution to ensure beam stability. Includes examples and calculations.

E N D
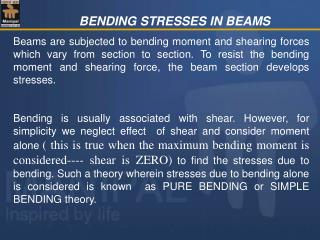
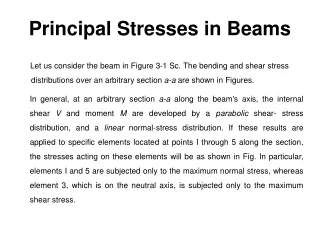
Principal Stresses in Beams Let us consider the beam in Figure 3-1 Sc. The bending and shear stress distributions over an arbitrary section a-a are shown in Figures. In general, at an arbitrary section a-a along the beam's axis, the internal shear V and moment M are developed by a parabolic shear- stress distribution, and a linear normal-stress distribution. If these results are applied to specific elements located at points I through 5 along the section, the stresses acting on these elements will be as shown in Fig.In particular, elements I and 5 are subjected only to the maximum normal stress, whereas element 3, which is on the neutral axis, is subjected only to the maximum shear stress.
1 2 3 4 5 4 4
5 5 4 4 3 3 2 2 1 1
The intermediate elements 2 and 4 resist both normal and shear stress. In each case the state of stress can be transformed into principal stresses, using either the stress-transformation equations or Mohr's circle. The results are shown in Fig. If this analysis is extended to many vertical sections along the beam other an a-a, a profile of the results can be represented by curves called stress trajectories.
Pattern of stress trajectories of a beam in bending derived optically,
Stress Trajectories: A knowledge of the directions of the principal stresses may aid in the prediction of the directions of cracks in a brittle material (concrete, for example) and thus may aid in the design of reinforcement to carry the tensile stresses. Curves drawn with their tangents at each point in the directions of the principal stresses are called stress trajectories. The lines intersect the neutral axis at 45° angles, and the solid and dashed lines always intersect at 90°. Knowing the direction of these lines can help engineers decide where to reinforce a beam so that it does not crack or become unstable. Since there are, in general, two nonzero principal stresses at each point (plane stress), there are two stress trajectories passing through each point. These curves will be perpendicular since the principal stresses are orthogonal; one set of curves will represent the maximum stresses, whereas the other represents the minimum stresses.
Shear failure of reinforced concrete beam: (a) overall view; (b) detail near right support
The trajectories for a simply supported rectangular beam carrying a concentrated load at the midpoint are shown in Fig. 6-26, with dashed lines representing the directions of the compressive stresses and solid lines showing tensile stress directions. In the vicinities of the load and reactions there are stress concentrations, and the trajectories become much more complicated. Figure 6-26 neglects all stress concentrations. In order to determine the principal stresses and the maximum shearing stresses at a particular point in a beam, it is necessary to calculate the fiber stresses and transverse (or longitudinal) shearing stresses at the point. With the stresses on orthogonal planes through the point known, the methods \can be used to calculate the maximum stresses at the point. The following example illustrates the procedure and provides an example-in which the principal stresses at some interior point are greater than the maximum fiber stresses.
Problem: A simply supported beam of 2ft. span in subjected to a load of 60,000 lb at its centre the cross-section is show in Fig. Find the maximum normal and shearing stresses at the junction of the flange and web.
P = 60,000 lb R2 30,000 lb R1 30,000 lb 1’ 1’ +30,000 + SFD ¯ -30,000 +30,000 lb-ft BMD +
C1 = 6" C2 = 6"
5.625 5.25/2 5.25
4424 Psi 5871.17 Psi
Then the principal stress is It is seen that (1) the principal stress at the junction between flange and web is larger than the tensile stress in the most remote fiber (1 > max) and therefore should be considered in design.
Problem: In the previous problem Find the span length (l) such that the maximum Principal stress at the junction between flange and the web will be equal to the maximum flexural stress in the extreme fiber. As by Condition:
max (5.25)" x 6" 6"
Assignment A cantilever beam loaded as shown in Figure a. Find The maximum normal stresses and shearing stress in the beam at the junction of the flange and the web.