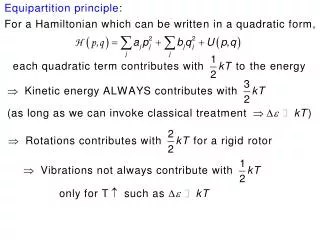
Principle :
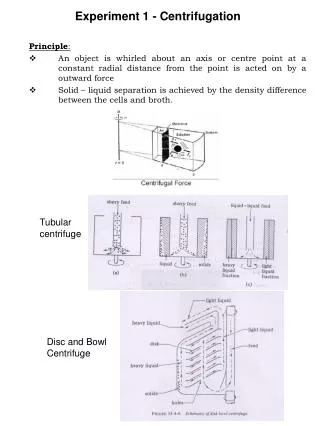
Experiment 1 - Centrifugation. Principle : An object is whirled about an axis or centre point at a constant radial distance from the point is acted on by a outward force Solid – liquid separation is achieved by the density difference between the cells and broth. Tubular centrifuge.

Principle :
E N D
Presentation Transcript
Experiment 1 - Centrifugation Principle: • An object is whirled about an axis or centre point at a constant radial distance from the point is acted on by a outward force • Solid – liquid separation is achieved by the density difference between the cells and broth. Tubularcentrifuge Disc and Bowl Centrifuge
Theory: According to stokes law vg = Dp2 (p - )g / 18 Vg - settling velocity due to gravity in m/s Dp - particle diameter in m p - particle density in Kg/m3 - liquid density in Kg/m3 • - liquid viscosity in Pa.s g - gravitational constant m/s2 Equation for sedimentation in centrifuge vt = 2 r Dp2 (p - ) / 18 Vt - settling velocity in m/s r - distance from the axis in m - angular velocity in s-1 = 2 n/60 n – speed in rps vt/vg =Z = r 2 /g Z is the relative centrifugal force of the centrifuge Scaleup of Centrifuge: Factor is the characterization of centrifuge. Q = vg Q = Feed flow rate in m3/s for disc and bowl centrifuge =(r 2/g)(2/3) N (r22-r12)Cot r2 - max radius of the disc r1 - min radius of the disc N - no of discs - angle of the disc cone Q=Dp2 (p - ) g / 18 Scale up of centrifuge Q1 / 1 = Q2 / 2 1 refers to lab centrifuge 2 refers to scale up centrifuge
Aim : • Calculate the relative centrifugal force developed by the centrifuge and sigma value of the centrifuge. • Run the yeast suspension at different flow rates and calculate the critical particle diameter of the yeast. • Calculate the scaleup sigma factor required for processing 500 l/h yeast supension Procedure: • Note down the dimensions of discs (r2 ,r1), no of discs, angle of the cone, max speed the centrifuge can operate. • Measure the flowrate of the pump for given tubing at different speed • Start the centrifuge and run it at maximum speed 6000- 8000 rpm. Open the operating fluid valve. • Set the flow rate and start feeding. • After few minutes of operation check the clarity of supernatunt. • Increase the flow rate of the feed and repeat the above step. • Continue increasing the flow rate till you observe loss of yeast cells in the supernatunt. • Findout the maximum flow rate at which there is no loss of product is observed. This is the critical flow rate at which the centrifuge will be operated. • Also observe how the solids are ejected intermittently by stopping the operating liquid. • Calculate the g force developed and factor for the centrifuge • Calculate the critical particle diameter of the yeast • Calculate the factor required for given scaleup conditions.
Observation and Calculation Particle density “p”- Kg/m3 Liquid density “” - Kg/m3 Liquid viscosity “µ” - Pa.s Max radius of the disc “r2” - m Min radius of the disc “r1”- m No of discs “N” - Angle of the disc cone “” - Distance from the axis “r” - m Speed “n” - rpm Angular velocity “” = 2 n/60 s-1 = = Sigma factor “” = (r 2/g)(2/3) N (r22-r12)Cot m2 = =
Table Calculation Q=Dp2 (p - ) g / 18 Scaleup Sigma factor Q1 / 1 = Q2 / 2
Experiment 2 - Microfiltration Principle: • Solid – liquid separation is achieved by the size of the particle. Here the particles lesser than the pore size of the membrane will pass through the membrane and that above the size will be retained by the membrane. Theory: Membrane processes offer following advantages: • Processing can be at low temperatures • Chemical and mechanical stresses can be minimized • Loss of cells are minimized • Equipment is easily scaled up, is flexible and less maintenance Micro filtration can be two types 1. Dead End Filtration 2. Cross flow filtration
Modes of Operation of Microfiltration Microfiltration described in terms of Flux J volume/(Area * Time) J = (V/ t) / A Micro filtration is pressure driven process; therefore pressure affects flux. Flux is proportional to the pressure drop (P)/ membrane thickness(Tm). J = K P / Tm K – constant accounts for variables such as pore size, viscosity of the solution, and porosity of the membrane. Resistance of the membrane Rm = Tm/(K * ) J = P / (Rm ) In cross flow filtration a small cake forms on the membrane. Hence the flux is not only affected by membrane resistance but also due to cake resistance and fouling resistance. J = P / {(Rm+ Rc+Rg) }
Aim: • Calculate the membrane (carbosep) resistance and Calculate the cake and fouling resistance • Calculate the flux in LMH • Calculate the membrane (carbosep) area required for processing 500 l/h yeast suspension. Procedure: • Check the clean water flux of the membrane by setting different P. Plot of P Vs Flux J will give you the membrane resistance. • Set P for running the batch concentration of yeast suspension. • Take 300 ml yeast suspension and start the yeast concentration. • Note down the flux and time taken for every 50 ml of permeate is removed. Continue concentration till 270 ml permeate is removed. • Calculate the average flux of the membrane in LMH • Again calculate the clean water flux by setting different P. Plot of P Vs Flux J will give you the combined resistance of membrane, cake and fouling. • Calculate the membrane area required for scaleup conditions given.
Observation and Calculation Clean water Flux Plot Flux Vs P. Slope will give 1/ Rm Yeast Concentration P = Plot Fold concentration Vs Flux Calculate average LMH
Clean water flux after microfiltration Plot Flux Vs P. Slope will give 1/ {(Rm+ Rc+Rg) } Calculate membrane area required for processing 500 l/h yeast suspension
Experiment 3 - Ultrafiltration Principle: • Separation is achieved by the molecular weight of the substance (protein/carbohydrate etc.,). Here the substance lesser than the cut off of the membrane will pass through the membrane and that above the cut off will be retained by the membrane. • Ultrafiltration membrane pore sizes are not absolute i.e for ex if the molecular weight cut off of the membrane is 50 kDa not necessary that all the proteins less than 50 kDa will pass through the membrane. The separation also depend on the shape of the protein such as globular or fibrous, charge interactions of protein and membrane, nature of the protein (some may sticky in nature) etc., Theory : Same as microfiltration Aim: • Calculate the membrane (sartocon slice) resistance and Calculate the cake and fouling resistance • Calculate the lactose content in the milk and using dialysis mode of three volume replacement calculate what percentage of lactose is removed. • Calculate the loss of protein in this operation. • Calculate the membrane (sartocon slice) area required for processing 5000 l/h milk proteins Procedure: • Check the clean water flux of the membrane by setting different P. Plot of P Vs Flux J will give you the membrane resistance. • Set P for running the dialysis mode of concentration of milk for lactose removal. • Take 500 ml milk and dilute to 2000 ml and take initial sample for lactose and protein estimation. Start the concentration • Note down the initial time. Continue concentration till 1500 ml permeate is removed and note down the final time. Take sample from retentate and permeate for estimation of protein and lactose.
Again makeup the milk to 2000 ml and start concentration. Repeat the above step. • Once again repeat the concentration after making up with water. • Calculate the average flux of the membrane in LMH • Again calculate the clean water flux by setting different P. Plot of P Vs Flux J will give you the combined resistance of membrane, cake and fouling. • Do the protein estimation by Bradford method and Lactose estimation by hydrolysis and glucose estimation. • Calculate what percentage of lactose is removed in every stage and what will be the protein loss. • Calculate the membrane area required for scaleup conditions given. Observation and Calculation Clean water Flux Plot Flux Vs P. Slope will give 1/ Rm
Milk protein concentration and diafiltration for lactose removal P = Calculate average LMH Clean water flux after ultrafiltration Plot Flux Vs P. Slope will give 1/ {(Rm+ Rc+Rg) }
Do protein estimation and lactose estimation Calculate the loss of protein in the operation and percentage of lactose removed in every stage of diafiltration Calculate membrane area required for processing 5000 l/h milk protein concentration and diafiltration
Principle : French press consist of high pressure displacement pump coupled to an adjustable, restricted discharge valve. Fluid is pressurised to high pressure and releasing the pressure suddenly through the orifice causes disruption A – Hand wheel for pressure control B – Spring loaded valve rod C – Valve D – Valve seat E – Impact ring Theory Extent of cell disruption in French press is a function of following parameters Operating pressure Number of passes thro’ the valve Valve design Operating temperature Type of cells Condition on which they are grown Disruption by homogenization follows first order kinetics ln(1-R) = -KN R - Fraction of cells ruptured N - Number of passes K - the rate constant Experiment 4 – Cell Disruption : French Press
Aim • Determine the optimum pressure and no of passes required for cell disruption for release of invertase enzyme • Calculate the rate constant at different pressure Procedure: • Wash the French pressure cell with distilled water repeatedly and set the pressure for disruption • Take 35 ml of yeast suspension and do cell disruption. Take sample (1ml) initially and after every two passes. • Continue the experiment upto 10 passes. • In the same way repeat the experiment in two more pressures. • Do protein estimation by Bradford for all the samples and also calculate invertase activity for one set of samples • Plot ln (1-R) Vs no of passes N using protein data and invertase data. • Calculate the first order rate constant. • Observe how the rate constant, no of passes varies with pressure • Find the optimum pressure and no of passes for release of 95% protein. Observation and Calculation Total protein in the sample is estimated by keeping the initial sample with two volumes of 0.1 N NaOH in boiling water bath for 10 mins and protein estimation of the sample is done using Bradford. Total protein in the sample = mg/ml Fraction of the protein released (R) = Protein in the sample/Total cell protein Invertase activity = micromoles of glucose released /min Total Invertase activity = Invertase activity of the initial sample Fraction of the Invertase released (R) = Invertase in the sample/Total Invertase activity
ln(1-R) = -KN R - Fraction of cells ruptured N - Number of passes K - the rate constant Plot no of passes Vs ln (1-R) using Enzyme released data and Protein released data. The slope will give –K Value Plot no of passes Vs Fraction of protein released and enzyme released. From the graph find out the optimum no of passes required.
Experiment 5 – Cell Diruption : Dynomill Principle: • Dyno mill consist of chamber in which glass beads are filled. This glass beads are rotated at high speed by agitator. The glass beads rupture the cells by a combination of high shear and impact with the cells. Theory: Degree of disruption is affected by number of parameters such as • Agitator design • Agitator tip speed • Beads diameter • Beads loading • Cell concentration • Cell type Cell disruption in dyno mill follows first order kinetics. ln{Rm/(Rm-R)} = kt Rm - maximal obtainable protein conc. R - concentration of protein released t - time Aim: • Calculate the rate constant at different speed • Calculate the cycle time required for cell disruption of yeast for release of enzyme • Calculate the optimum bead size for cell lysis
Procedure: • Fill the chamber with glass beads upto 85% volume. • Wash the beads with water and remove the water. • Fill the chamber with yeast suspension and do cell disruption. Take sample (1ml) initially and after every two minutes. • Continue the experiment upto 10 minutes. • In the same way repeat the experiment in two more speed. • Do protein estimation by Bradford for all the samples and also calculate invertase activity for one set of samples • Plot ln [Rm/(Rm-R)] Vs time using protein data and invertase data. • Calculate the first order rate constant. • Observe how the rate constant, varies with presssure • Find the optimum time and speed for 95% protein release. • Every batch do with different size of bead and finally we can find which size is better Observation and Calculation Total protein in the sample is estimated by keeping the initial sample with two volumes of 0.1 N NaOH in boiling water bath for 10 mins and protein estimation of the sample is done using Bradford. Total protein in the sample(Rm) = mg/ml Fraction of the protein released (R) = Protein in the sample/Total cell protein Invertase activity = micromoles of glucose released /min Total Invertase activity (Rm) = Invertase activity of the initial sample Fraction of the Invertase released (R) = Invertase in the sample/Total Invertase activity
ln{Rm/(Rm-R)} = kt Rm - maximal obtainable protein conc. R - concentration of protein released t - time Plot time Vs ln Rm/(Rm-R) using Enzyme released data and Protein released data. The slope will give K Value Plot time Vs Fraction of protein released and enzyme released. From the graph find out the optimum time required for disruption.
Principle: At low concentrations, the presence of salt stabilizes the various charged groups on a protein molecule, thus attracting protein into the solution and enhancing the solubility of protein. This is commonly known as salting-in. However, as the salt concentration is increased, a point of maximum protein solubility is usually reached. Further increase in the salt concentration implies that there is less and less water available to solubilize protein. Finally, protein starts to precipitate when there are not sufficient water molecules to interact with protein molecules. This phenomenon of protein precipitation in the presence of excess salt is known as salting-out. Theory: Inorganic salts are used for protein precipitation. Most commonly ammonium sulphate is used for precipitation. Advantages of using Ammonium sulphate for precipitation are at saturation, it is of sufficiently high molarity that it causes the precipitation of most proteins it does not have a large heat of solution, allowing heat generated to be easily dissipated its saturated solution (4.04 M at 20 C) has a density (1.235g cm-3) that does not interfere with the sedimentation of most precipitated proteins by centrifugation its concentrated solutions are generally bacteriostatic in solution it protects most proteins from denaturation. Depending on the protein properties eg. hydrophobicity, precipitation of different proteins occur at different salt concentrations. This is employed to selectively precipitate the protein of interest. Concentration and partial purification of protein of interest can be achieved by fractional precipitation. Experiment 6 – Ammonium Sulphate precipitation
Aim: • Extract the proteins from sprouted moong dhal • Do Ammonium sulphate precipitation to precipitate acid phosphatase enzyme • By this step calculate how many fold purification is achieved. Procedure: • Prepare 100 mM citrate buffer pH 4.0 • Weigh 10 gms moong dhall and mash it in mortar and pastel along with citrate buffer 25 ml. • Filter using cloth and centrifuge the filtrate to get clear supernatunt. Take initial sample. • Prepare 4.0 M ammonium sulphate (saturated solution). • Take 10 ml sample and add 2.5 ml saturated ammonium sulphate. This will give 20% saturation solution. • Proteins will be precipitated. Centrifuge the precipitated protein. Collect the supernatunt and suspend the pellet in 500 ul water. • Store 200 ul sample from the supernatunt for estimation and add another 7.5 ml of saturated ammonium sulphate to the supernatunt. This will give 50 % saturation solution. • Proteins will be precipitated. Centrifuge the precipitated protein. Collect the supernatunt and suspend the pellet in 500 ul water. • Store 200 ul sample of supernatunt and precipitate for estimation. • Do protein estimation and acid phosphatase estimation of all the samples and find out whether all the enzyme is precipitated. • Calculate the fold purification and enzyme loss in this purification
Observation and Calculations: Total enzyme in the supernatunt /precipitate = Enzyme activity X volume of supernatunt /precipitate Total protein in the supernatunt /precipitate = Protein concentration X volume of supernatunt /precipitate % Loss of enzyme = [1 – (Total enzyme in precipitates /Total enzyme in initial sample)] X 100
Specific activity of the initial sample = Total enzyme activity of initial sample / total protein of initial sample Specific activity of the 20 % precipitate = Total enzyme activity of 20 % precipitate / total protein of 20 % precipitate Specific activity of the 50 % precipitate = Total enzyme activity of 50 % precipitate / total protein of 50 % precipitate Fold purification = Specific activity of the precipitate/specific activity of the initial sample
Experiment 7 – Aqueous two phase extraction Principle: When two polymers or polymer and salt are mixed in particular concentrations two immiscible phases are formed and when we do this with fermentation broth or cell lysates partioning of protein occurs. Theory: Aqueous two-phase extraction (ATPE) has been widely used for protein recovery and purification. In ATPE, two immiscible phases are formed when polymers such as polyethylene glycol (PEG) are mixed with other polymers, such as dextran, ficoll or salts (ammonium sulphate, sodium sulphate etc)in particular concentrations. The equilibrium distribution (partitioning) of a protein in ATPE depends not only on its own surface properties such as charge and hydrophobicity but also on the physicochemical properties of the two phases, which can be manipulated by adjusting factors such as the polymer molecular weight and concentration, type of phase forming salt, salt concentration, ionic strength, and pH. In the plot between polymer-polymer or polymer-salt concentrations, the curve separating the single phase and two phases of that system is called as Binodal curve. Two phases are formed in the concentrations above the binodal curve.Developing the binodial curve is necessary for choosing system parameters for preliminary partition experiments. This can be constructed by Cloud point method. In this method few grams of concentrated polymer solution are weighed into a test tube. A solution of known concentration of the second polymer or salt is added drop-by-drop to the test tube and mixed. The solution is clear at first, but after a certain amount of the second solution (polymer or salt) is added, one further drop makes the mixture turbid and the mixture separates into two phases. The mass of the mixture is noted and the composition of the two phase system is determined. The above procedure is repeated over a whole range of concentrations starting from both the solutions of the two-phase system.
Aim: • Extract the proteins from sprouted moong dhal • Construct binodal curve for PEG 8000, Sodium sulphate system. • Do ATPE for separating acid phosphatase. By this step calculate how many fold purification is achieved. Procedure: • Prepare 40 % sodium sulphate solution and take it in burette. • Prepare 5 ml each of 10%, 20%, 30%, 40%, 50% PEG 8000 and titrate it against sodium sulphate till turbidity appears. Note down the volume of sodium sulphate. From that calculate the mass of PEG and sodium sulphate and construct Binodal curve. • Prepare 100 mM citrate buffer pH 4.0 • Weigh 10 gms moong dhall and mash it in mortar and pastel along with citrate buffer 25 ml. • Filter using cloth and centrifuge the filtrate to get clear supernatunt. Take initial sample. • Take 10 ml sample and add 3.0 gms sodium sulphate. • To this mixture add 3.0 ml 50% PEG 8000 and check whether two phases are forming. Mix the contents thoroughly. • Allow it to settle and separate the two phases by careful pipetting. Note down the volume of each phase. • Check the protein estimation and acid phosphatase for initial sample and both the phase samples • Check whether the acid phosphatase is there in aqueous phase or organic phase. • Calculate the fold purification and loss in this stage of purification
Observation and Calculations: Construct the binodal curve Concentration of PEG Vs Concentration of Na2SO4 Volume of Salt Phase = Volume of polymer phase =
Total enzyme in the Salt phase or Polymer phase = Enzyme activity X volume of Salt phase or Polymer phase Total protein in the Salt phase or Polymer phase = Protein concentration X volume of Salt phase or Polymer phase % Loss of enzyme ={1-(Total enzyme in polymer phase /Total enzyme in initial sample)} X 100 Specific activity of the initial sample = Total enzyme activity of initial sample / total protein of initial sample Specific activity of the polymer phase = Total enzyme activity of polymer phase / total protein of polymer phase Fold purification = Specific activity of the polymer phase/specific activity of the initial sample
Experiment 8 – Ion Exchange Chromatography Principle: • In the Ion exchange chromatography based on the charge of the protein the separation is achieved. Theory: • An ion exchanger consists of an insoluble matrix to which charged groups have been covalently bound. The charged groups are associated with mobile counterions. These counter-ions can be reversibly exchanged with other ions of the same charge without altering the matrix. • It is possible to have both positively and negatively charged exchangers. Positively charged exchangers have negatively charged counter-ions (anions) available for exchange and are called anion exchangers. Negatively charged exchangers have positively charged counter-ions (cations) and are termed cation exchangers.
The charge of a protein is determined by its pI and the buffer pH. • If the pH is greater than the pI, the protein will have a negative charge. The greater the difference between the pH and the pI, then the more negative will be charge of the protein. • If the pH is less than the pI, then the protein will have a positive charge. The greater the pI is above the pH, then the more positive will the charge of the protein be. • For example, consider a protein with a pI of 7: • The terms strong and weak refer to the extent of variation of ionization with pH and not the strength of binding. • A strong exchanger is one which remains almost fully ionized over a wide pH range while a weak exchanger is ionized over a small pH range. Ion exchange groups used in protein purification Strong anion-CH2N+(CH3)3 - Triethylaminomethyl -C2H4N+(C2H5)3 - Triethylaminoethyl -C2H4N+(C2H5)2CH2CH(OH)CH3 - Diethyl-2-hydroxypropylaminoethyl Weak anion-C2H4N+H3 - Aminoethyl -C2H4NH(C2H5)2 - Diethylaminoethyl Strong cation-SO3- - Sulpho CH2SO3- - Sulphomethyl C3H6SO3- - Sulphopropyl Weak cation-COO- - Carboxy -CH2COO- - Carboxymethyl
Once the protein is bound to column it is eluted by two methods: • Gradient salt elution The principle behind a salt gradient elution strategy is that the weakest bound ions should be eluted first. • Gradient pH elution For a cation exchange column, elution starts from a low pH to a higher pH. For an anion exchange column, elution starts from a high pH to a lower pH. Steps in Chromatography:
Aim: • Purify lysozyme using Ion exchange chromatography Procedure: • Selection of the matrix is done based on the pI of the protein. Lysozyme is having pI of 11. At the pH less than11 (for ex at pH 9.5) it will have positive charge. Hence cation exchanger can be used. Here cation strong cation exchanger SP Sepharose is used for the experiment. • Pack 1 ml SP sepharose in the column. • Wash the matrix thoroughly with water to remove ethanol or isopropanol (Normally matrix are stored in20% ethanol or 30% isopropanol) • Equilibrate the column with 10 column volumes of glycine buffer pH 9.5 • Add 2 ml of diluted egg white sample to the column. Collect the unbound proteins in test tube. • Wash the nonspecifically bound or unbound proteins in void space with 10 column volumes of glycine buffer pH 9.5. Collect the wash sample in the test tubes. • Elute the lysozyme in steps of 0.1 M, 0.3 M, 0.5 M and 1M NaCl in glycine buffer. Collect the samples in different test tubes. Note the volume of each concentration eluate. • Do the enzyme assay and protein estimation for all the samples. • Calculate the % loss of enzyme and fold purification in this step. Observation and Calculations: Enzyme activity is calculated by the rate of lysis of Micrococcus luteus 1 Lysis unit is defined as reduction of 0.1 OD of 1ml culture in 1 min.
Total enzyme in the sample = Enzyme activity X volume of sample Total protein in the sample = Protein concentration X volume of sample
% Loss of enzyme ={1-(Total enzyme in eluted sample /Total enzyme in initial sample)} X 100 Specific activity of the initial sample = Total enzyme activity of initial sample / total protein of initial sample Specific activity of the eluted sample = Total enzyme activity of eluted sample / total protein of eluted sample Fold purification = Specific activity of the eluted sample /specific activity of the initial sample
Experiment 9 – Affinity Chromatography Principle: • Affinity chromatography separates proteins on the basis of a reversible interaction between a protein (or group of proteins) and a specific ligand coupled to a chromatography matrix. Theory: • Biological interactions between ligand and target molecule can be a result of electrostatic or hydrophobic interactions, van der Waals' forces and/or hydrogen bonding. • To elute the target molecule from the affinity medium the interaction can be reversed, either specifically using a competitive ligand, or non-specifically, by changing the pH, ionic strength or polarity. • Affinity chromatography is having high selectivity, hence high resolution, and high capacity for the protein(s) of interest, purification levels in the order of several thousand-fold with high recovery of active material are achievable. • Successful affinity purification requires a biospecific ligand that can be covalently attached to a chromatography matrix. Matrix with Ligand Binding the specific protein to the ligand Eluting the protein Regeneration
Some typical biological interactions, frequently used in affinity chromatography, are listed below: • For Enzymes ::: Substrate analogue, inhibitor, cofactor. • For Antibody ::: Antigen, virus, cell. • For Poly (His) fusion proteins, or native proteins with histidine, cysteine and/or tryptophan residues on their surfaces ::: Divalent Metal ions • Affinity chromatography is also used to remove specific damaging contaminants, for example Benzamidine Sepharose™ 6 Fast Flow can remove serine proteases. Steps in Affinity chromatography: • Pre-activated matrices: matrices which have been chemically modified to facilitate the coupling of specific types of ligand. • Ligand coupling: covalent attachment of a ligand to a suitable pre-activated matrix to create an affinity medium. • Binding: buffer conditions are optimized to ensure that the target molecules interact effectively with the ligand and are retained by the affinity medium as all other molecules wash through the column. • Elution: buffer conditions are changed to reverse (weaken) the interaction between the target molecules and the ligand so that the target molecules can be eluted from the column. pH elution :A change in pH alters the degree of ionization of charged groups on the ligand and/or the bound protein. This change may affect the binding sites directly, reducing their affinity, or cause indirect changes in affinity by alterations in conformation. Ionic strength elution:The exact mechanism for elution by changes in ionic strength will depend upon the specific interaction between the ligand and target protein. This is a mild elution using a buffer with increased ionic strength (usually NaCl), applied as a linear gradient or in steps. Competitive elution:Selective eluents are often used to separate substances on a group specific medium or when the binding affinity of the ligand/target protein interaction is relatively high. The eluting agent competes either for binding to the target protein or for binding to the ligand. • Wash: buffer conditions that wash unbound substances from the column without eluting the target molecules or that re-equilibrate the column back to the starting conditions (in most cases the binding buffer is used as a wash buffer).
Aim: • Purify the his tagged Green Fluorescent protein using affinity chromatography {Immobilised Metal Affinity Chromatography (IMAC)} Reagents: Nickel solution: 0.1 M NiSO4 Binding buffer: 20mM sodium phosphate, 0.5M NaCl, 10mM imidazole, pH 7.4 Elution buffer: 20mM sodium phosphate,0.5M NaCl, 500mM imidazole, pH 7.4 Stripping buffer: 20mM sodium phosphate, 0.5M NaCl, 0.05 M EDTA, pH 7.4. Storage : 20% ethanol Procedure: • Selection of matrix: Chelating Sepharose Fast flow matrix (Sepharose preactivated with iminodiacetic acid for coupling metal i.e Nickel ion). • Chelating Sepharose, when charged with Ni2+ ions, selectively binds proteins if complex forming amino acid residues, in particular histidine, are exposed on the protein surface. • Wash the column with 5 column volumes of distilled water. • Load 0.5 column volumes of the 0.1 M nickel solution onto the column. • Wash with 5 column volumes of distilled water. • Equilibrate the column with 10 column volumes of binding buffer. • Apply sample (Binding capacity : 12 mg target protein per ml of matrix) at a flow rate 1–4 ml/min (5 ml column). Collect the flow-through fraction. A pump is more suitable for application of sample volumes greater than 15 ml. Collect the unbound fraction. • Wash with 10 column volumes of binding buffer. Collect wash fraction. • Elute with 5 column volumes of elution buffer. Collect eluted fractions in small fractions such as 1 ml to avoid dilution of the eluate. • Do the protein estimation fluorescence readings of all the fractions Note: • Use water, not buffer, to wash away the column storage solution which contains 20% ethanol. This avoids the risk of nickel salt precipitation in metal loading step • Imidazole absorbs at 280 nm. Use elution buffer as blank when monitoring absorbance. • If imidazole needs to be removed, use a desalting column. • The loss of metal ions is more pronounced at lower pH.
Cleaning • Removal of nickel ions before re-charging or storage: 1. Wash with 5 column volumes of 20 mM sodium phosphate, 0.5 M NaCl, 0.05 M EDTA, pH 7.4. 2. Wash with 10 column volumes of distilled water. 3. For storage, wash with 5 column volumes of 20% ethanol. • Removal of precipitated proteins: 1. Fill column with 1 M NaOH and incubate for 2 hours. • Wash out dissolved proteins with 5 column volumes of water and a buffer at pH 7.0 until the pH of the flow-through reaches pH 7.0. Observation and Calculations: • Total GFP in the sample = Fluorescence units X volume of sample • Total protein in the sample = Protein concentration X volume of sample
% Loss of GFP ={1-(Total GFP in eluted sample /Total GFP in initial sample)} X 100 Specific activity of the initial sample = Total GFP activity of initial sample / total protein of initial sample Specific activity of the eluted sample = Total GFP activity of eluted sample / total protein of eluted sample Fold purification = Specific activity of the eluted sample /specific activity of the initial sample
Acid Phosphatase enzyme assay • Prepare following stock solutions 1mg/ml pNPP 0.1 N NaOH • Take 50 ml of substrate in ELISA plate • Add 50 ml sample • Incubate for 10 minutes at RT. • Arrest the reaction by adding 50 ml 0.1 N NaOH • Take reading at 405 nm Note: If the colour is too dark dilute the sample. Protein Estimation – Bradford method • Take 200 ml of bradford reagent in ELISA Plate • Add 10 ml of sample • Incubate for 10 minutes at RT • Take the reading at 600 nm • Also do standard at concentrations 2 mg, 5 mg & 10 mg Note: If the colour is too dark dilute the sample Lysozyme assay • Take 200 ml of 1 OD Micrococcus luteus cells in ELISA Plate • Add 10 of sample • Take the reading at 600 nm every two minutes and findout the rate of decreaase in OD per minute.
Invertase enzyme assay • Take 3 ml of 10% sucrose solution in 100 mM phosphate buffer • Add 0.5 ml of your sample • Incubate at 55 oC for 15 minutes • Keep the samples in Ice to arrest the reaction • Estimate glucose in the sample by enzymatic kit. • Take 200 ml enzyme reagent • Add 10 ml sample • Incubate for 15 minutes at RT • Take reading at 495 nm • Also do standard at concentrations 2 mg, 5 mg & 10 mg Lactose estimation Hydrolysis of Lactose: • Take 1 ml sample. • Add 50 ml of Concentrated HCl • Boil at 95 oC for 10 min • Add 150 ml of 5 N NaOH • Estimate glucose in the sample by enzymatic kit. • Take 200 ml enzyme reagent • Add 10 ml sample • Incubate for 15 minutes at RT • Take reading at 495 nm • Also do standard at concentrations 2 mg, 5 mg & 10 mg