Download
1 / 2
20 likes | 210 Vues
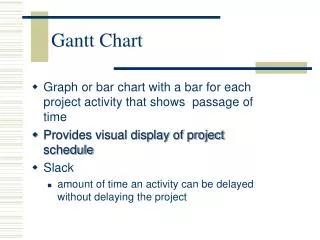
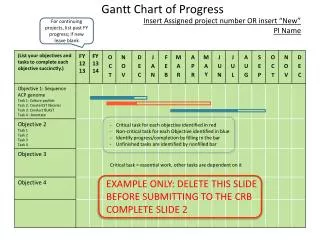
Gantt Chart of Progress. Insert Assigned project number OR insert “New”. For continuing projects, list past FY progress; if new leave blank. PI Name. Critical task for each objective identified in red Non-critical task for each Objective identified in blue

E N D
Gantt Chart of Progress Insert Assigned project number OR insert “New” For continuing projects, list past FY progress; if new leave blank PI Name • Critical task for each objective identified in red • Non-critical task for each Objective identified in blue • Identify progress/completion by filling in the bar • Unfinished tasks are identified by nonfilled bar Critical task = essential work, other tasks are dependent on it EXAMPLE ONLY: DELETE THIS SLIDE BEFORE SUBMITTING TO THE CRB COMPLETE SLIDE 2
Gantt Chart of Progress LEGEND Critical Tasks = red bar Non-critical Task = blue bar Completed = Filled bar Not-complete = nonfilled or partially filled bar Insert Assigned project number OR insert “New” PI Name