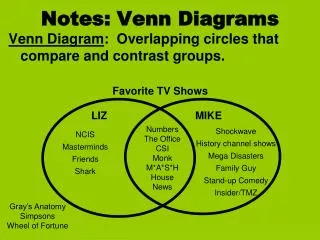
Venn Diagrams
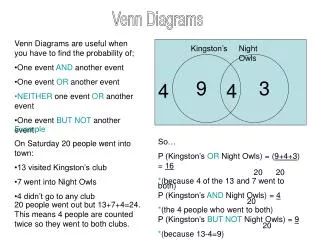
Venn Diagrams. Diagram used as a pictorial representative for a probability concept or rule. Venn Diagrams. Rolling one die, find P(greater than 3 AND odd). Greater than 3 Odd. 1. 4. 5. 3. 6. 2. P(greater than 3 and odd) = ____{5}_____ = 1

Venn Diagrams
E N D
Presentation Transcript
Venn Diagrams Diagram used as a pictorial representative for a probability concept or rule
Venn Diagrams Rolling one die, find P(greater than 3 AND odd) Greater than 3 Odd 1 4 5 3 6 2 P(greater than 3 and odd) = ____{5}_____ = 1 {1, 2, 3, 4, 5, 6} 6
VennDiagrams Rolling one die, find P(greater than 3 ORodd) Greater than 3 Odd 1 4 5 3 6 2 P(greater than 3 OR odd) = __{1, 3, 4, 5, 6}_= 5 {1, 2, 3, 4, 5, 6} 6
Empirical Probability Based on the observations obtained from an experiment Frequency of event E total frequency _f_ n P (E) = =
Empirical Rule (Example) Fish Type # of times caught (f) Blue Gill 39 Red Gill 51 Crappy 30 Σf = 120 P(Blue Gill) = 39/120 = 13/40
Law of Large Numbers As an experiment is repeated over and over, the empirical probability of an event approaches the theoretical (actual) probability of the event
Complement The set of all outcomes in a sample space that are not included in the event Symbol- E’
Complement P (E) + P(E’) = 1 P(E) = 1 – P(E’) P(E’) = 1 – P(E)
Subjective Probability Uses a probability value based on an educated guess or estimate, utilizing opinions and inexact information
Subjective Probability Ex: After watching the students in the hallway between classes your English teacher states that about 15% of the students are in violation of the dress code.
Section 1 of Worksheet Identify the sample space of the following probability experiment using a tree diagram. Ex: Tossing a dime and a penny Start Tossing the dime HEADS TAILS Tossing the penny HEADS TAILS HEADS TAILS
Section 2 of Worksheet Classify the following statements as an example of classical, empirical, or subjective probability. Ex: After watching ducks at the pond, Lizzy decides that only about 10% of the ducks swim around alone. Subjective Probability
Section 2 of Worksheet Classify the following statements as an example of classical, empirical, or subjective probability. Ex: All 30 students in class flip a coin once and 20 of these students get tails. Empirical Probability
Section 2 of Worksheet Classify the following statements as an example of classical, empirical, or subjective probability. Ex: When Brandon plays Craps he has a 1/6 chance that he will roll a 7 on his first roll Classical Probability