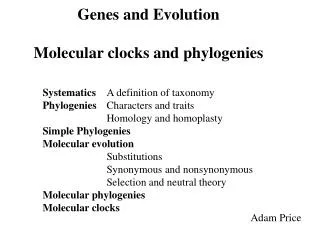

Molecular Clocks
E N D
Presentation Transcript
Molecular Clocks Rose Hoberman
The Holy Grail Fossil evidence issparse and imprecise (or nonexistent) Predict divergence times by comparing molecular data
H C M R D 110 MYA • Given • a phylogenetic tree • branch lengths (rt) • a time estimate for one (or more) node • Can we date other nodes in the tree? • Yes... if the rate of molecular change is constant across all branches
Rate Constancy? Page & Holmes p240
Protein Variability • Protein structures & functions differ • Proportion of neutral sites differ • Rate constancy does not hold across different protein types • However... • Each protein does appear to have a characteristic rate of evolution
Evidence for Rate Constancyin Hemoglobin Large carniverous marsupial Page and Holmes p229
TheMolecular Clock Hypothesis • Amount of genetic difference between sequences is a function of time since separation. • Rate of molecular change is constant (enough) to predict times of divergence
Outline • Methods for estimating time under a molecular clock • Estimating genetic distance • Determining and using calibration points • Sources of error • Rate heterogeneity • reasons for variation • how its taken into account when estimating times • Reliability of time estimates • Estimating gene duplication times
Measuring Evolutionary time with a molecular clock • Estimate genetic distance d = number amino acid replacements • Use paleontological data to determine date of common ancestor T = time since divergence • Estimate calibration rate (number of genetic changes expected per unit time) r = d / 2T • Calculate time of divergence for novel sequences T_ij = d_ij / 2r
Estimating Genetic Differences If all nt equally likely, observed difference would plateau at 0.75 Simply counting differences underestimates distances Fails to count for multiple hits (Page & Holmes p148)
Estimating Genetic Distance with a Substitution Model • accounts for relative frequency of different types of substitutions • allows variation in substitution rates between sites • given learned parameter values • nucleotide frequencies • transition/transversion bias • alpha parameter of gamma distribution • can infer branch length from differences
Distances from Gamma-Distributed Rates • rate variation among sites • “fast/variable” sites • 3rd codon positions • codons on surface of globular protein • “slow/invariant” sites • Trytophan (1 codon) structurally required • 1st or 2nd codon position when di-sulfide bond needed • alpha parameter of gamma distribution describes degree of variation of rates across positions • modeling rate variation changes branch length/ sequence differences curve
Gamma Corrected Distances • high rate sites saturate quickly • sequence difference rises much more slowly as the low-rate sites gradually accumulate differences • Felsenstein Inferring Phylogenies p219
The ‘Sloppy’ Clock • ‘Ticks’ are stochastic, not deterministic • Mutations happen randomly according to a Poisson distribution. • Many divergence times can result in the same number of mutations • Actually over-dispersed Poisson • Correlations due to structural constraints
Poisson Variance(Assuming A Pefect Molecular Clock) If mutation every MY • Poisson variance • 95% lineages 15 MYA old have 8-22 substitutions • 8 substitutions also could be 5 MYA Molecular Systematics p532
Need for Calibrations • Changes = rate*time • Can explain any observed branch length • Fast rate, short time • Slow rate, long time • Suppose 16 changes along a branch • Could be 2 * 8 or 8 * 2 • No way to distinguish • If told time = 8, then rate = 2 • Assume rate=2 along all branches • Can infer all times
Estimating Calibration Rate • Calculate separate rate for each data set (species/genes) using known date of divergence (from fossil, biogeography) • One calibration point • Rate = d/2T • More than one calibration point • use regression • use generative model that constrains time estimates (more later)
Calibration Complexities • Cannot date fossils perfectly • Fossils usually not direct ancestors • branched off tree before (after?) splitting event. • Impossible to pinpoint the age of last common ancestor of a group of living species
Linear Regression • Fix intercept at (0,0) • Fit line between divergence estimates and calibration times • Calculate regression and prediction confidence limits Molecular Systematics p536
Molecular DatingSources of Error • Both X and Y values only estimates • substitution model could be incorrect • tree could be incorrect • errors in orthology assignment • Poisson variance is large • Pairwise divergences correlated (Systematics p534?) • inflates correlation between divergence & time • Sometimes calibrations correlated • if using derived calibration points • Error in inferring slope • Confidence interval for predictions much larger than confidence interval for slope
Rate Heterogeneity • Rate of molecular evolution can differ between • nucleotide positions • genes • genomic regions • genomes (nuclear vs organelle), species • species • over time • If not considered, introduces bias into time estimates
Local Clocks? • Closely related species often share similar properties, likely to have similar rates • For example • murid rodents on average 2-6 times faster than apes and humans (Graur & Li p150) • mouse and rat rates are nearly equal (Graur & Li p146)
Working Around Rate Heterogeneity • Identify lineages that deviate and remove them • Quantify degree of rate variation to put limits on possible divergence dates • requires several calibration dates, not always available • gives very conservative estimates of molecular dates • Explicity model rate variation
Search for Genes with Uniform Rate across Taxa Many ‘clock’ tests: • Relative rates tests • compares rates of sister nodes using an outgroup • Tajima test • Number of sites in which character shared by outgroup and only one of two ingroups should be equal for both ingroups • Branch length test • deviation of distance from root to leaf compared to average distance • Likelihood ratio test • identifies deviance from clock but not the deviant sequences
Likelihood Ratio Test • estimate a phylogeny under molecular clock and without it • e.g. root-to-tip distances must be equal • difference in likelihood ~ 2*Chi^2 with n-2 degrees of freedom • asymptotically • when models are nested • when nested parameters aren’t set to boundary
Relative Rates Tests • Tests whether distance between two taxa and an outgroup are equal (or average rate of two clades vs an outgroup) • need to compute expected variance • many triples to consider, and not independent • Lacks power, esp • short sequences • low rates of change • Given length and number of variable sites in typical sequences used for dating, (Bronham et al 2000) says: • unlikely to detect moderate variation between lineages (1.5-4x) • likely to result in substantial error in date estimates
R N D E F M A B C Modeling Rate VariationRelaxing the Molecular Clock • Learn rates and times, not just branch lengths • Assume root-to-tip times equal • Allow different rates on different branches • Rates of descendants correlate with that of common acnestor • Restricts choice of rates, but still too much flexibility to choose rates well
Relaxing the Molecular Clock • Likelihood analysis • Assign each branch a rate parameter • explosion of parameters, not realistic • User can partition branches based on domain knowledge • Rates of partitions are independent • Nonparametric methods • smooth rates along tree • Bayesian approach • stochastic model of evolutionary change • prior distribution of rates • Bayes theorem • MCMC
Parsimonious Approaches • Sanderson 1997, 2002 • infer branch lengths via parsimony • fit divergence times to minimize difference between rates in successive branches • (unique solution?) • Cutler 2000 • infer branch lengths via parsimony • rates drawn from a normal distribution (negative rates set to zero)
Bayesian ApproachesLearn rates, times, and substitution parameters simultaneously Devise model of relationship between rates • Thorne/Kishino et al • Assigns new rates to descendant lineages from a lognormal distribution with mean equal to ancestral rate and variance increasing with branch length • Huelsenbeck et al • Poisson process generates random rate changes along tree • new rate is current rate * gamma-distributed random variable
Comparison of Likelihood & Bayesan Approaches for Estimating Divergence Times (Yang & Yoder 2003) • Analyzed two mitochondrial genes • each codon position treated separately • tested different model assumptions • used • 7 calibration points • Neither model reliable when • using only one codon position • using a single model for all positions • Results similar for both methods • using the most complex model • use separate parameters for each codon position (could use codon model?)
Sources of Error/Variance • Lack of rate constancy (due to lineage, population size or selection effects) • Wrong assumptions in evolutionary model • Errors in orthology assignment • Incorrect tree • Stochastic variability • Imprecision of calibration points • Imprecision of regression • Human sloppiness in analysis • self-fulfilling prophecies
Reading the entrails of chickens (Graur and Martin 2004) • single calibration point • error bars removed from calibration points • standard error bars instead of 95% confidence intervals • secondary/tertiary calibration points treated as reliable and precise • based on incorrect initial estimates • variance increases with distance from original estimate • few proteins used
Multiple Gene Loci • “Trying to estimate time of divergence from one protein is like trying to estimate the average height of humans by measuring one human” --Molecular Systematics p539 Use multiple genes! (and multiple calibration points)
Even so...Be Very Wary Of Molecular Times • Point estimates are absurd • Sample errors often based only on the difference between estimates in the same study • Even estimates with confidence intervals unlikely to really capture all sources of variance
McLysaght, Hokamp, Wolfe 2002Dating Human Gene Duplications • [758] Trees generated (ML method using PAM matrix) • [602] Alpha parameter for gamma distribution learned • (Gu and Zhang 1997) faster than ML, more accurate than parsimony • Thrown out if variance > mean. Why would this happen? • “May be problematic to apply this model for gene family evolution because of the possible functional divergence among paralogous genes” • [481] NJ trees built from Gamma-corrected distances • Family kept only if worm/fly group together • [191] Two-cluster test of rate constancy (Takezaki et al 1995)
Blanc, Hokamp, WolfeDating Arabadopsis Duplications • Create nucleotide alignments • Estimate “Level of” Synonymous substitutions (Yang’s ML method) • per site? per synonymous site? • Ks values > 10 ignored (Yang; Anisimova) • Why used different method than for human? • How reliable is ranking of Ks values? How much variance expected?
Ks > 10 unreliable ? • Yang (abstract) calculates effect of evolutionary rate on accuracy of phylogenic reconstruction • Anisimova calculates accuracy and power of LRT in detecting adaptive molecular evolution • Neither seems to give any cutoff regarding dS > 10.
Future Improvements • Calculate accurate confidence intervals taking into account multiple sources of variance • Novel models that account for variation in rates between taxa • Build explicit models that predict rates based on an understanding of the underlying processes that generate differences in substitutions rates
General References Reviews/Critiques • Bronham and Penny. The modern molecular clock, Nature review in genetics?, 2003. • Graur and Martin. Reading the entrails of chickens...the illusion of precision. Trends in Genetics, 2004. Textbooks: • Molecular Systematics. 2nd edition. Edited by Hillis, Moritz, and Mable. • Inferring Phylogenies. Felsenstein. • Molecular Evolution, a phylogenetic approach. Page and Holmes.
Rate Heterogeneity References Dealing with Rate Heterogeneity • Yang and Yoder. Comparison of likelihood and bayesian methods for estimating divergence times... Syst. Biol, 2003. • Kishino, Thorne, and Bruno. Performance of a divergence time estimation method under a probabilistic model of rate evolution. Mol. Biol. Evol, 2001. • Huelsenbeck, Larget, and Swofford. A compound poisson process for relaxing the molecular clock. Genetics, 2000. Testing for Rate heterogeneity • Takezaki, Rzhetsky and Nei. Phylogenetic test of the molecular clock and linearized trees. Mol. Bio. Evol., 1995. • Bronham, Penny, Rambaut, and Hendy. The power of relative rates test depends on the data. J Mol Evol, 2000.
Dating Duplications References Dating duplications: • McLysaght, Hokamp, and Wolfe. Extensive genomic duplication during early chordate evolution. Nature Genetics?, 2002. • Blanc, Hokamp, and Wolfe. Recent polyploidy superimposed on older large-scale duplications in the Arabidopsis genome. Genome Research, 2003. Reference used for dating duplications in above papers • Gu and Zhang. A simple method for estimating the parameter of substitution rate variation among sites. Mol. Biol. Evol., 1997. • Yang Z. On the best evolutionary rate for phylogenetic analysis. Syst. Biol, 1998. • Anisimova, Bielawski, Yang. Accuracy and power of the likelihood ratio test in detecting adaptive molecular evolution. Mol. Biol. Evol., 2001.