Functional Assessment of Induced Pluripotent Stem Cell-Derived Endothelial Cells using Invasion and Proliferation Assays
This study investigates the expression and functionality of induced pluripotent stem cell-derived endothelial cells (iPSC-ECs), focusing on their low-density lipoprotein (LDL) uptake, proliferation in response to various stimuli, and invasive capabilities through a Matrigel-coated membrane. Employing real-time impedance measurements using xCelligence technology, we detail methods for quantifying iPSC-EC proliferation and invasion, emphasizing the role of FGFR and VEGFR signaling, as well as microtubule organization, in regulating cell behavior.


Functional Assessment of Induced Pluripotent Stem Cell-Derived Endothelial Cells using Invasion and Proliferation Assays
E N D
Presentation Transcript
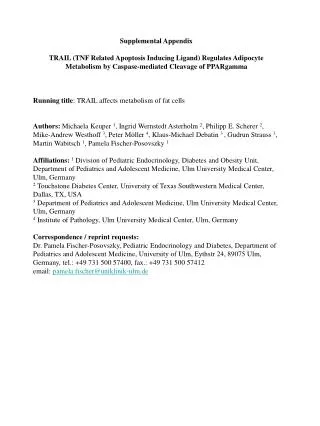
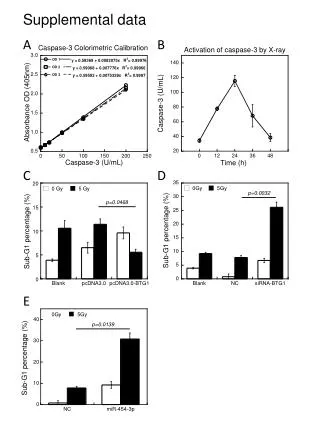
A B D C vWF Supplemental Figure 1. iPSC-EC expression and function. (A) Low density lipoprotein (LDL) uptake as performed using standard assay technique. (B) iPSC-EC proliferation in Growth Medium relative to the same measurement using CellTiterGlo assay. (C) Immunofluorescence and (D) FACs expression of vWF.
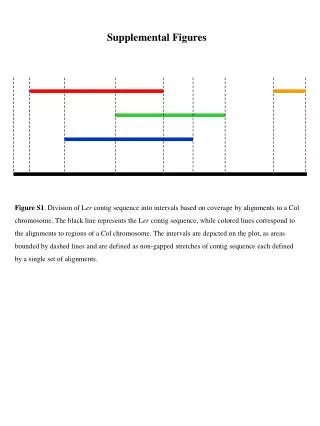
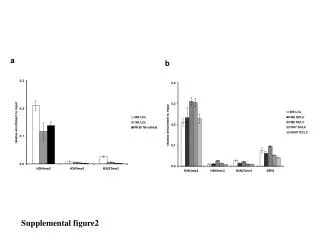
iPSC-EC Single-Cell Invasion in Real Time. To measure invasion of iPSC ECs, an impedance based systems was employed (xCelligence, ACEA system). In brief, the underside of the upper chamber of CIM-plates was pre-coated with fibronectin (15 μg/cm2, Invitrogen) for 1 hour at room temperature. 20µL of Matrigel was coated on the upper surface of the membrane at 200 µg mL-1 in Starvation Medium at 37°C, 5% CO2, and 95% relative humidity for 4 hours. Medium conditions were prepared in Starvation Medium with VEGF (R&D Systems) at the concentrations in Fig. 7C or 20 ng/mL VEGF with the inhibitor concentrations in Fig. 7A,B,D. Media was added to the bottom chamber of CIM plates, and the bottom and top chambers were assembled prior to experimentation and allowed to reach equilibrium for 1 hour at 37°C, 5% CO2, and 95% relative humidity. iPSC-ECs between Passage 2-4 were seeded at 10000 cells well-1 in a total volume of 100 µL in Starvation Medium with the inhibitor concentrations listed in Fig. 7 at 0.1 vol.% DMSO. Plates were incubated at 37°C, 5% CO2, and 95% relative humidity for 24 hours with data collected every 15 minutes. After 24 hours, the final cell indices were correlated to the experimental conditions, which were performed in triplicate and compared via Student’s t-test at p-value<0.05. A Δt Top Chamber Matrigel Bottom Chamber Membrane Electrodes B C Supplement Figure 2. iPSC-EC Invasion through Matrigel-Coated Membrane. (A) Schematic of “invasion” assay with iPSC-ECs, which differed from the migration assay in that a Matrigel coat separated the cells from the membrane and added an additional layer with which the cells invaded. (B,C)End-point analysis of iPSC-EC migration quantified using real-time impedance measurements in different concentrations of SU5402 (B)or nocodazole(C) in medium containing 10 vol.% serum with 20ng/mL VEGF in the bottom chamber and 10 vol.% serum and no VEGF in the top chamber. Statistical significance compared to the control without inhibitor is denoted is denoted for p-value < 0.05 (*).
iPSC-EC Single-Cell Migration in Real-Time. To measure proliferation of iPSC ECs in response to pharmacological inhibition, an impedance based systems was employed (xCelligence, ACEA Biosciences. In brief, E-Plates (ACEA Biosciences) was pre-coated with fibronectin (15 μg/cm2, Invitrogen) for 1 hour at room temperature. iPSC-ECs were seeded between Passage 2-5 at 1600 cells well-1 in Growth Medium for 24 hours at 37°C, 5% CO2, and 95% relative humidity. Growth Medium was replaced with Starvation Medium (0.1 vol.% supplement) with 20 ng mL-1 VEF (R&D Systems) and the inhibitor concentrations shown in 0.1 vol% DMSO (Sigma). Plates were incubated at 37°C, 5% CO2, and 95% relative humidity for 48 hours, and medium was replenished for an additional 24 hour incubation. The cell index at 96 hours was correlated for each condition, and data was analyzed using sigmoidal regression analysis in GraphPad Prism. A Proliferation Electrodes Δt Polystyrene Plate C B IC50 = 4nM IC50 = 8nM SU5402 (µM) Nocodazole (µM) • Supplemental Figure 3. iPSC-EC proliferation is dependent on FGFR/VEGFR signaling and microtubule organization • (A) Schematic of impedance-based measurements of cellular proliferation. After attachment, further increases in cell index were attributed to cellular proliferation. • (B,C)End-point analysis at 96 hours of iPSC-EC proliferation quantified using real-time impedance measurements in different concentrations of SU5402 (B)or nocodazole(C) with 0.1 vol.% serum and 20 ng/mL VEGF. Sigmoidal regression analysis was used to calculate an IC50 value for each inhibitor.