
Uploaded by
thelma
3 SLIDES
110 VUES
30LIKES
Ethanol Impact on Clot Formation Parameters: Stepwise Trend Analysis
DESCRIPTION
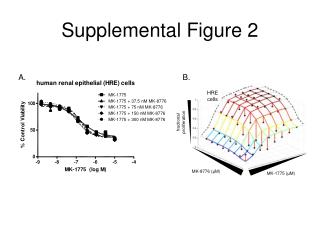
This study analyzes the effect of ethanol levels on clot formation parameters, showing a significant trend in R-time, K-time, and alpha angle. One-way ANOVA testing highlights significant differences, particularly in alpha angle between EtOH-negative and high-range EtOH groups.
Download
1 / 3
Download Presentation

Télécharger la présentation
Ethanol Impact on Clot Formation Parameters: Stepwise Trend Analysis
An Image/Link below is provided (as is) to download presentation
Download Policy: Content on the Website is provided to you AS IS for your information and personal use and may not be sold / licensed / shared on other websites without getting consent from its author.
Content is provided to you AS IS for your information and personal use only.
Download presentation by click this link.
While downloading, if for some reason you are not able to download a presentation, the publisher may have deleted the file from their server.
During download, if you can't get a presentation, the file might be deleted by the publisher.
E N D
Presentation Transcript
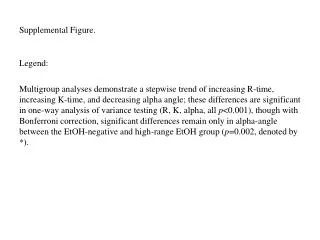
Supplemental Figure. Legend: Multigroup analyses demonstrate a stepwise trend of increasing R-time, increasing K-time, and decreasing alpha angle; these differences are significant in one-way analysis of variance testing (R, K, alpha, all p<0.001), though with Bonferronicorrection, significant differences remain only in alpha-angle between the EtOH-negative and high-range EtOH group (p=0.002, denoted by *).


More Related
Audio
Live Player