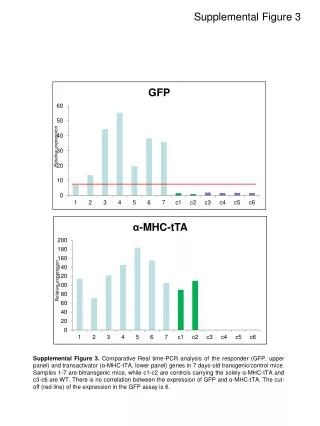
Analysis of Purified Collagens Col1 and Col3 in Cellular Extracts
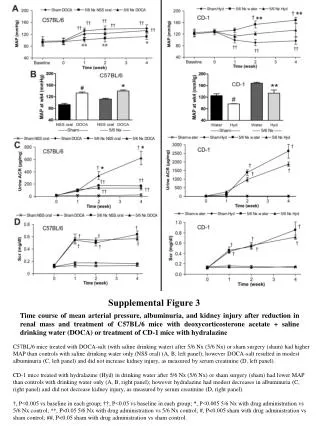
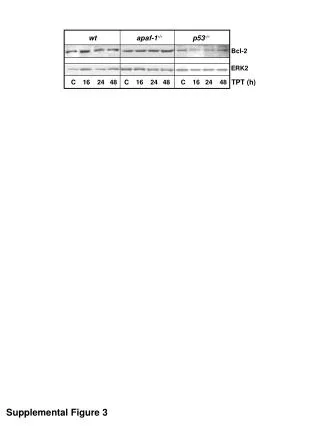
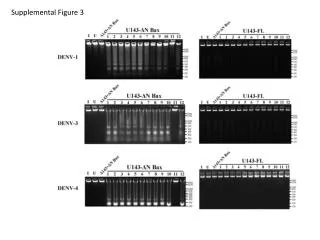
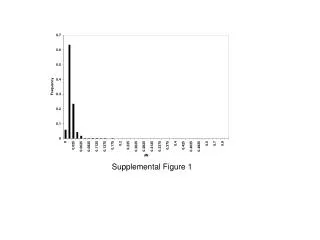
This supplemental figure presents data on purified collagen types 1 and 3, examining their concentrations in micrograms (μg) across various samples. The study assesses the relative expressions of collagen types Col1 and Col3 alongside actin, represented in arbitrary units. Sample concentrations range from 0.12 to 30 μg, highlighting the differences in protein levels between various samples. These insights are critical for understanding collagen distribution and its implications in biological processes.

Analysis of Purified Collagens Col1 and Col3 in Cellular Extracts
E N D
Presentation Transcript
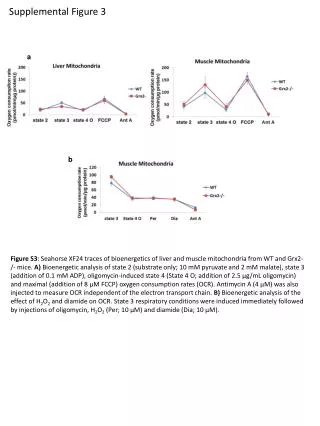
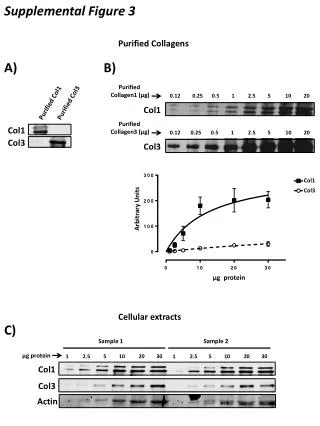
Supplemental Figure 3 Purified Collagens A) B) Purified Collagen1 (μg) 0.12 0.25 0.5 1 2.5 5 10 20 Purified Col1 Purified Col3 Col1 Purified Collagen3 (μg) Col1 0.12 0.25 0.5 1 2.5 5 10 20 Col3 Col3 Col1 Col3 Arbitrary Units μg protein Cellular extracts C) Sample 1 Sample 2 μg protein 1 2.5 5 10 20 30 1 2.5 5 10 20 30 Col1 Col3 Actin