
Uploaded by
natane
1 SLIDES
160 VUES
10LIKES
Supplemental Figure 3
DESCRIPTION
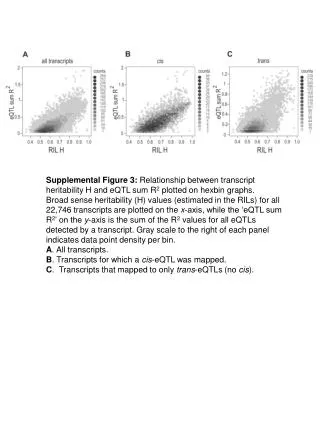
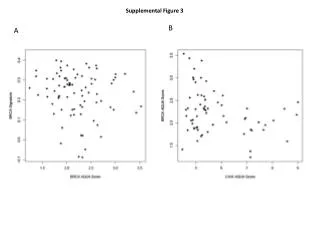
Supplemental Figure 3: Relationship between transcript heritability H and eQTL sum R 2 plotted on hexbin graphs.
Download
1 / 1
Télécharger la présentation 
Supplemental Figure 3
An Image/Link below is provided (as is) to download presentation
Download Policy: Content on the Website is provided to you AS IS for your information and personal use and may not be sold / licensed / shared on other websites without getting consent from its author.
Content is provided to you AS IS for your information and personal use only.
Download presentation by click this link.
While downloading, if for some reason you are not able to download a presentation, the publisher may have deleted the file from their server.
During download, if you can't get a presentation, the file might be deleted by the publisher.
E N D
Presentation Transcript
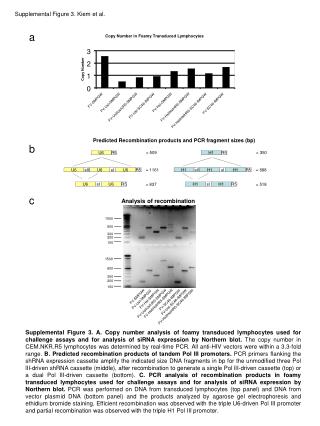
Supplemental Figure 3: Relationship between transcript heritability H and eQTL sum R2 plotted on hexbin graphs. Broad sense heritability (H) values (estimated in the RILs) for all 22,746 transcripts are plotted on the x-axis, while the ‘eQTL sum R2’ on the y-axis is the sum of the R2 values for all eQTLs detected by a transcript. Gray scale to the right of each panel indicates data point density per bin. A. All transcripts. B. Transcripts for which a cis-eQTL was mapped. C. Transcripts that mapped to only trans-eQTLs (no cis).


More Related