Inhibition of TLR2 in Primary MDS BM CD34+ Cells
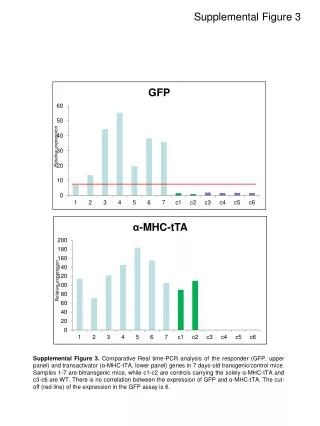
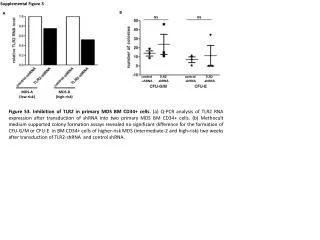
Study on TLR2 inhibition in MDS BM CD34+ cells, analyzing TLR2 RNA expression post-shRNA transduction. Colony formation assays showed no significant differences in CFU-G/M or CFU-E formation in high-risk MDS cells after TLR2-shRNA transduction.

Inhibition of TLR2 in Primary MDS BM CD34+ Cells
E N D
Presentation Transcript
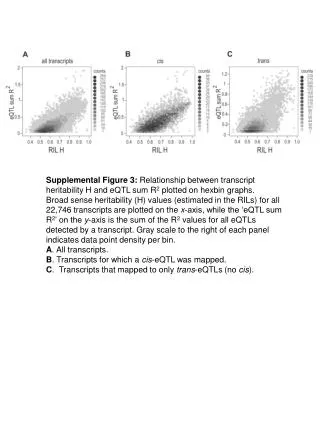
Supplemental Figure 3 B A NS NS control -shRNA TLR2 -shRNA control -shRNA TLR2 -shRNA MDS-A (low-risk) MDS-B (high-risk) Figure S3. Inhibition of TLR2 in primary MDS BM CD34+ cells. (a) Q-PCR analysis of TLR2 RNA expression after transduction of shRNA into two primary MDS BM CD34+ cells. (b) Methocult medium supported colony formation assays revealed no significant difference for the formation of CFU-G/M or CFU-E in BM CD34+ cells of higher-risk MDS (intermediate-2 and high-risk) two weeks after transduction of TLR2-shRNA and control shRNA.