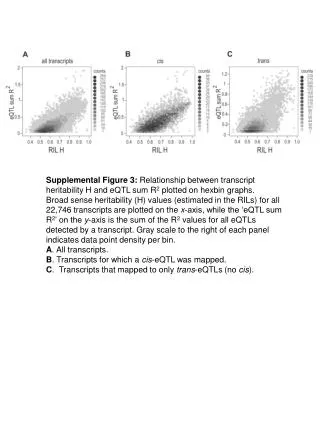
Supplemental Data Figure 3
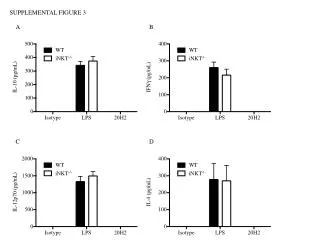
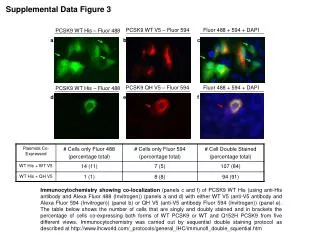
This figure presents the results of immunocytochemistry performed on PCS-K9 variants using double staining methods. The co-localization of PCS-K9 WT.His and PCS-K9 QH.V5 with their respective fluorochromes (Fluor 594 and Fluor 488) is demonstrated in panels c and f. The table summarizes the quantitative analysis of singly and doubly stained cells across five views, highlighting the percentage of cells co-expressing both PCS-K9 forms. The sequential double staining protocol utilized aligns with established procedures for effective visualization.

Supplemental Data Figure 3
E N D
Presentation Transcript
Supplemental Data Figure 3 PCSK9 WT V5 – Fluor 594 Fluor 488 + 594 + DAPI PCSK9 WT His – Fluor 488 a b c PCSK9 QH V5 – Fluor 594 Fluor 488 + 594 + DAPI PCSK9 WT His – Fluor 488 d e f Immunocytochemistry showing co-localization (panels c and f) of PCSK9 WT His (using anti-His antibody and Alexa Fluor 488 (Invitrogen)) (panels a and d) with either WT V5 (anti-V5 antibody and Alexa Fluor 594 (Invitrogen)) (panel b) or QH V5 (anti-V5 antibody Fluor 594 (Invitrogen)) (panel e). The table below shows the number of cells that are singly and doubly stained and in brackets the percentage of cells co-expressing both forms of WT PCSK9 or WT and Q152H PCSK9 from five different views. Immunocytochemistry was carried out by sequential double staining protocol as described at http://www.ihcworld.com/_protocols/general_IHC/immunofl_double_squential.htm