Analysis of Liver and Muscle Mitochondria Bioenergetics in WT and Grx2-/- Mice
This study presents Seahorse XF24 traces comparing bioenergetics of liver and muscle mitochondria from WT and Grx2-/- mice. It includes bioenergetic analysis of different respiratory states and the effects of H2O2 and diamide on oxygen consumption rates.

Analysis of Liver and Muscle Mitochondria Bioenergetics in WT and Grx2-/- Mice
E N D
Presentation Transcript
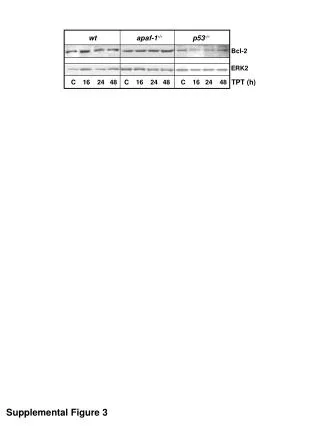
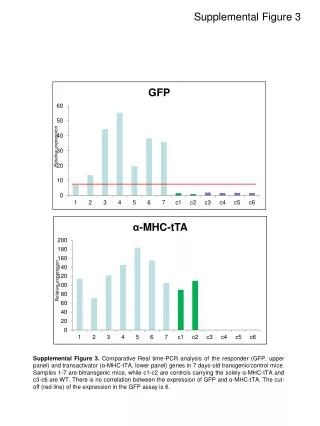
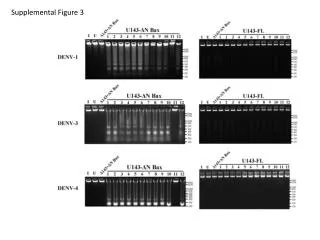
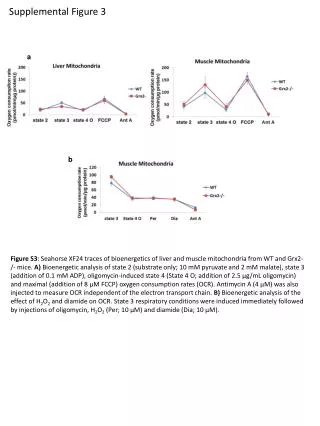
Supplemental Figure 3 a b Figure S3: Seahorse XF24 traces of bioenergetics of liver and muscle mitochondria from WT and Grx2-/- mice. A) Bioenergetic analysis of state 2 (substrate only; 10 mMpyruvate and 2 mMmalate), state 3 (addition of 0.1 mMADP), oligomycin-induced state 4 (State 4 O; addition of 2.5 μg/mL oligomycin) and maximal (addition of 8 μMFCCP) oxygen consumption rates (OCR). Antimycin A (4 μM) was also injected to measure OCR independent of the electron transport chain. B)Bioenergetic analysis of the effect of H2O2 and diamide on OCR. State 3 respiratory conditions were induced immediately followed by injections of oligomycin, H2O2 (Per; 10 μM) and diamide (Dia; 10 μM).