Download
1 / 1
10 likes | 80 Vues
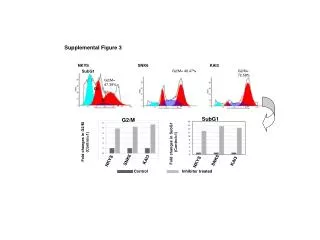
This study investigates the fold changes in the SubG1 and G2/M phases in SNK6, NKYS, and KAI3 cell lines compared to control, determining significant alterations in cell cycle progression.

E N D
SupplementalFigure 3 Control Inhibitor treated SNK6 NKYS KAI3 SubG1 G2/M= 48.47% G2/M= 72.58% G2/M= 47.39% G1 S SubG1 G2/M Fold changes in SubG1 (Control=1) Fold changes in G2/M (Control=1) SNK6 KAI3 SNK6 NKYS KAI3 NKYS