ZnT8A Antibody Levels in Type 1 Diabetes Samples: DASP 2009
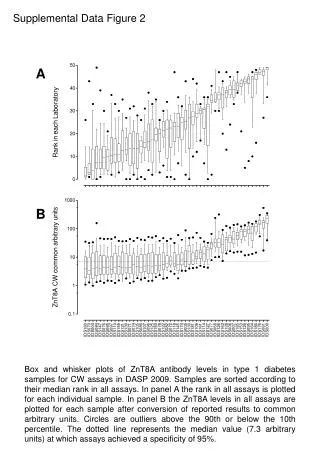
Box & whisker plots showing ZnT8A antibody levels in type 1 diabetes samples for CW assays in DASP 2009, sorted by median rank. Panel A displays individual sample ranks in all assays, while Panel B shows ZnT8A levels in all assays converted to common arbitrary units. Outliers are marked as circles, and the median value of 7.3 arbitrary units indicates 95% assay specificity.

ZnT8A Antibody Levels in Type 1 Diabetes Samples: DASP 2009
E N D
Presentation Transcript
Supplemental Data Figure 2 Box and whisker plots of ZnT8A antibody levels in type 1 diabetes samples for CW assays in DASP 2009. Samples are sorted according to their median rank in all assays. In panel A the rank in all assays is plotted for each individual sample. In panel B the ZnT8A levels in all assays are plotted for each sample after conversion of reported results to common arbitrary units. Circles are outliers above the 90th or below the 10th percentile. The dotted line represents the median value (7.3 arbitrary units) at which assays achieved a specificity of 95%.