
Uploaded by
fala
1 SLIDES
91 VUES
10LIKES
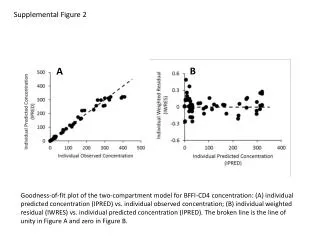
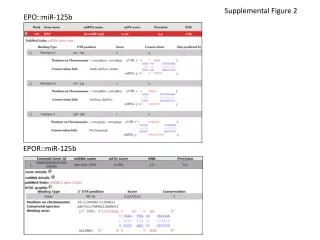
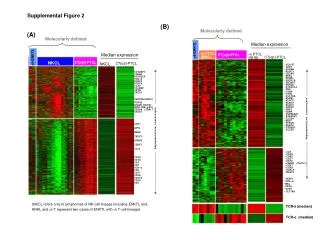
Two-Compartment Model for BFFI-CD4 Concentration Analysis
DESCRIPTION
This supplemental figure presents a goodness-of-fit plot for the two-compartment model analyzing BFFI-CD4 concentration. It compares individual predicted concentration against observed concentration and plots individual weighted residual against predicted concentration. The broken line represents unity in Figure A and zero in Figure B.
Download
1 / 1
Download Presentation

Télécharger la présentation
Two-Compartment Model for BFFI-CD4 Concentration Analysis
An Image/Link below is provided (as is) to download presentation
Download Policy: Content on the Website is provided to you AS IS for your information and personal use and may not be sold / licensed / shared on other websites without getting consent from its author.
Content is provided to you AS IS for your information and personal use only.
Download presentation by click this link.
While downloading, if for some reason you are not able to download a presentation, the publisher may have deleted the file from their server.
During download, if you can't get a presentation, the file might be deleted by the publisher.
E N D
Presentation Transcript
Supplemental Figure 2 B A Goodness-of-fit plot of the two-compartment model for BFFI-CD4 concentration: (A) individual predicted concentration (IPRED) vs. individual observed concentration; (B) individual weighted residual (IWRES) vs. individual predicted concentration (IPRED). The broken line is the line of unity in Figure A and zero in Figure B.
More Related
Audio
Live Player