Download
1 / 24
260 likes | 471 Vues
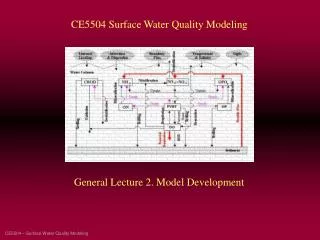
ENVE5504 Surface Water Quality Modeling. Lab 2. Modeling Loads – The C/Q Approach Applied to Onondaga Lake. Types of Loads. load, mass · time -1 , g · d -1. point source, tributaries: Q · C, m 3 ·d -1 x g·m -3. nonpoint terrestrial source: UAL·A, g·m 2 ·d -1 x m 2.

E N D
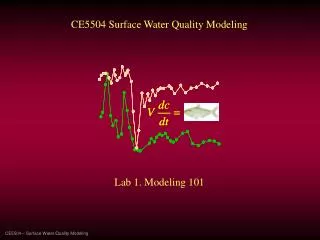
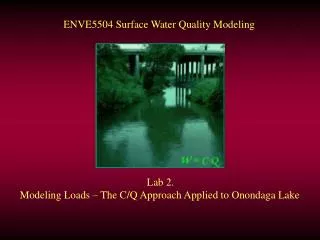
ENVE5504 Surface Water Quality Modeling Lab 2. Modeling Loads – The C/Q Approach Applied to Onondaga Lake
Types of Loads load, mass·time-1, g·d-1 point source, tributaries: Q·C, m3·d-1 x g·m-3 nonpoint terrestrial source: UAL·A, g·m2·d-1 x m2 nonpoint atmospheric source: J·A, g·m2·d-1 x m2 sediment source: J·A, g·m2·d-1 x m2 What is “A” for the last 3 cases?
Steady State C, Constant Loads and, at steady state, where W is constant and quantified as shown in the previous slide.
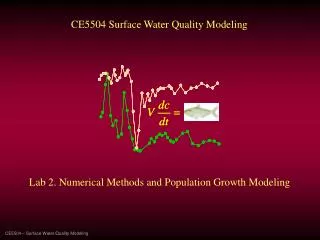
Time Variable C, Time Variable Loads applying numerical integration, how to describe W(t) ?
Time Variable C, Idealized, Time Variable Loads Impulse load (spill) then an initial concentration is calculated, and the integration proceeds with W = 0 0
Time Variable C, Idealized, Time Variable Loads Step load (new continuous source) where an initial concentration corresponding to prior conditions is specified
Time Variable C, Idealized, Time Variable Loads Linear load where an initial concentration corresponding to prior conditions or Wbase is specified
Time Variable C, Idealized, Time Variable Loads Exponential load where an initial concentration corresponding to prior conditions or We is specified
Time Variable C, Idealized, Time Variable Loads Sinusoidal load where an initial concentration corresponding to prior conditions or Wbar is specified
The Clean Water Act and TMDLs In 1972, the Federal Water Pollution Control Act was amended requiring, in part, a minimum level of control based on available treatment technologies. Where implementation of those technologies does not result in water quality standards being met, Section 303 of the Act requires that regulators, Establish Total Maximum Daily Loads (TMDLs) for these waters at levels necessary to meet applicable water quality standards, accounting for seasonal variations and with a margin of safety to reflect lack of certainty about discharges and water quality. This can be accomplished through a modeling approach where C represents the water quality standard and W represents the ‘necessary level’ of load, e.g.
Identifying Loading Sources Example - Deer Lake, Michigan sediments tribs WWTP
Characterizing and Quantifying Loads load, mass·time-1, g·d-1 point source, tributaries: Q·C, m3·d-1 x g·m-3 nonpoint terrestrial source: UAL·A, g·m2·d-1 x m2 nonpoint atmospheric source: J·A, g·m2·d-1 x m2 sediment source: J·A, g·m2·d-1 x m2
Deer Lake Loads load, mass·time-1, g·d-1 • Consider challenges in quantifying these, e.g. • accounting for seasonal variations and • establishing a margin of safety
Quantifying Tributary Loads C b USGS a clueless Q Approach: develop the relationship between C and Q, e.g. as expressed in a C/Q plot. Apply that relationship to derive C values from the USGS Q data base and then use W(t) = Q·C to calculate the load.
C/Q for TSS in Ontonagon River, Lake Superior • linear • bipartite • ascending - descending
C/Q for Chloride in Nine Mile Creek, Onondaga Lake • inverse linear plot • two different historical intervals
C/Q for TSS in Onondaga Creek, Onondaga Lake • logC plot
C/Q for Total Phosphorus in Onondaga Creek, Onondaga Lake • log – log plot • two different stations
Regression Analysis of Maumee River Phosphorous Loading Data Water Years 2003-2005 Department of Natural and Applied Sciences University of Wisconsin Green Bay Charlie Piette and David Dolan Pete Richards National Center for Water Quality Research Heidelberg College
Maumee RiverFacts • Size • Contribution
Ode to the Load Little loads, like those from toads, Grow bigger when from horses. And on through us, I fear they must, Foul the water courses.