Download
1 / 12
130 likes | 289 Vues
Optically-Detected Electron Spin Resonance of Self-Assembled InAs Quantum Dots. (ODESR = ODMR, “optically- detected magnetic resonance”). John S. Colton, Brigham Young University Undergraduate students: Mitch Jones, Steve Brown, Dallas Smith, Scott Thalman, and Ken Clark.

E N D
Optically-Detected Electron Spin Resonance of Self-Assembled InAs Quantum Dots (ODESR = ODMR, “optically-detected magnetic resonance”) John S. Colton, Brigham Young University Undergraduate students: Mitch Jones, Steve Brown, Dallas Smith, Scott Thalman, and Ken Clark Samples provided by Allan Bracker, Naval Research Laboratory Talk for APS March Meeting, Mar 15, 2010
Energy +½ DE = gmB B –½ B Spin Resonance: Zeeman effect 14 nm GaAs quantum well Two things we easily learn from ODMR: • g-factor via peak position • hf = gmBBresonant • T2* spin lifetime (“inhomogeneous dephasing time”) via peak width • (T2*)-1 = gmBBhalfwidth • |g| = 0.349, T2* 9.4 ns
Bloch Sphere Kikkawa & Awschalom, 1997 Two things we easily learn from ODMR: • g-factor via peak position • T2* spin lifetime via peak width Compare to time-resolved Faraday/Kerr rotation: • g-factor through frequency of oscillation • hf = gmBB • T2* through decay of oscillation • e-t/T2*
Linearly polarized cw probe laser Balanced detector Computer Lockin amplifier vert data horiz Polarizing beam splitter reference control control Resonant cavity Pulse sequence generator Sample in cryostat/superconductingmagnet PIN diode switch Microwave source/amplifier Microwave resonance affects spin polarization ODMR with Kerr rotation detection Difference signal proportional to polarization angle proportional to spin polarization
Beff Well-known effect. Shortens T2*, for example. Quantum Well ODMR What’s going on? • Electron spins polarize the nuclei(when taken out of equilibrium) • Nuclear spins produce Beff Shifting and Broadening Various optical powers Heaton, et al., Solid State Comm. 150 (2010), “Nuclear effects in Kerr rotation-detected magnetic resonance of electrons in GaAs”
Quantum well, cont.: Wavelength Dependence Kerr.Rot. (non-resonant) Idea: select out particular QDs via wavelength Kerr.Rot. ODMR Tune laser to here: Exciton Trion
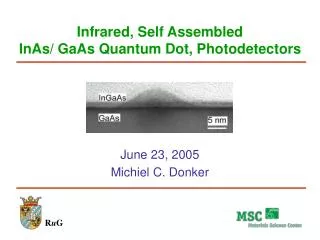
20 Figure from Kennedy, et al. Proc. SPIE, Vol. 6903 (2008) Sample: Self-assembled InAs QDs (A. Bracker, NRL) • “Cap-flush” method: • In layer (SAQDs) • GaAs partial layer • In flush • GaAs continued growth • Doping: 1.01010 cm-2 • Approx. 1 electron/dot
Laser here Some observations: • Peaks always start about 1.6-1.7 T • Peak widths always about the same • No finer structures • Peak positions never reproducible • Higher microwave/laser powers • more peaks, higher field peaks
Compare to time-resolved Kerr.Rot. of this sample: From Kennedy, et al. (unpublished) Weakest microwave power: • Peak position: |g//| = 0.485 • Peak width: T2* = 2.9 ns • Frequency: |g| = 0.43 • Decay at 2T: T2* = 0.4 ns • Faster decay at high fields due to g-factor inhomogenity • In a more heavily doped sample, Dg 0.1 (possibly less than that, here) • Pulsed laser (more spectral bandwidth)
What’s going on here? • Single peak T2* values of ~3 ns (vs. 0.4 ns) argue that we are seeing signal from a much more homogeneous subset of QDs, perhaps individual dots • Close to theoretical value expected for isolated QDs (from nuclear spin fluctuations changing during measurement) • T2* = 4.6 ns for nearly isolated donors in GaAs - Colton et al., Solid State Comm (2004) • Peaks from 1.6 - 2.8 T would correspond to |g| = 0.30 to 0.53. • A bit higher than Dg = 0.1 from time-resolved Kerr rot. • Are these the true resonant fields? Or shifted due to Beff (nuclear)?
The $64,000 questions • Are we seeing spin resonance of individual QDs at these different fields? • Don’t know • Would be remarkable • If not, each peak is at least from a very homogeneous group, with essentially the same g-factor • Could nuclear polarization perhaps explain why peaks are occurring at different fields? • Don’t know • Would require all electrons in group to be shifting together (peaks are apparently merging together, not broadening)
Conclusion • Saw ODMR from doped electrons in an InAs SAQD sample. • Wavelength selected out a small subset of QDs • Individual QDs? • May/may not have had nuclear spin effects causing ODMR peaks to shift • At the very least, it’s interesting! Where do we go from here? • More precise optical/microwave power dependence • Simultaneous rf to resonate nuclei • Sample with density gradient?