Download
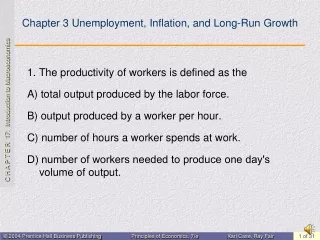
1 / 38
390 likes | 474 Vues
Explore the intricate web of consequences stemming from inflation and unemployment on economic growth. Learn about the costs of inflation, redistribution of income, and necessary unemployment levels. Discover how policy priorities and legislative acts shape monetary approaches. This insightful analysis delves into the effects of inflation on income distribution and borrowing, shedding light on real vs. nominal interest rates. Uncover the various costs associated with inflation, from informational and uncertainty costs to institutional and constitutional implications. Gain a comprehensive understanding of why managing inflation is key in maintaining a stable economic environment.

E N D
CHAPTER Grappling with Inflation, Unemployment, and Growth 3
Grappling with Inflation, Unemployment, and Growth • Costs of Inflation • Redistribution of Income • Informational and Uncertainty Costs • Institutional and Constitutional Costs • Menu and Shoe Leather Costs • Why Some Unemployment is Necessary • Flows In and Out of the Labor Market • Vacancies • Labor Market as a Matchmaker
Natural Rate of Unemployment • Cyclical Unemployment • The Phillips Curve
Policy Priorities • Since low inflation and low unemployment may conflict in the short run, policy makers must give one top priority • The Federal Reserve believes that • monetary policy does not affect the natural rate of unemployment • therefore, preventing inflation must be the primary goal of monetary policy
Legislative Basis of Policy • Employment Act of 1946 • Required the government to use all of its powers to promote “maximum employment, production, and purchasing power.” • Full Employment and Balanced Growth Act of 1978 • Requires the Fed chairman to present economic forecasts and targets for money supply growth to Congress twice a year
Effects of Inflation • Inflation makes buyers poorer because they must pay higher prices • Inflation makes sellers richer because they are paid higher prices • Since most people are both buyers (as consumers) and sellers (as owners of factors of production), the average person’s income and wealth aren’t changed by inflation
Inflation Redistributes Income • Inflation redistributes income from those who do not, or cannot, raise their prices to those who can, and do, raise their prices. • People do not raise prices if inflation is unanticipated. • People can not raise their prices if they are fixed by a contract.
Inflation Redistributes Income from Lenders to Borrowers • Suppose that you had planned to buy a pair of shoes for $100, but instead you lend the $100 to a friend for a year at 3% interest. • At the end of the year your friend repays you $103. • During the year, inflation was 5%, so now the shoes cost $105. • Your real rate of return was -2%.
Real and Nominal Interest Rates Nominal interest rate = Real interest rate + Anticipated inflation If lenders anticipate inflation, they add the amount of expected inflation to the real interest rate that they require to maintain their purchasing power.
Costs of Inflation • Informational Costs • Prices are used to make comparisons between goods, but inflation distorts that information. • Uncertainty Costs • Inflation may distort and delay expenditures because it makes predicting future prices more difficult.
Costs of Inflation • Institutional Costs • Inflation undermines institutions and conventions, such as rules of thumb and contracts, which are based on relatively fixed prices. • Constitutional Costs • Inflation undermines the convention of money that forms the basis of exchange in the economy.
Costs of Inflation • Menu Costs • Inflation requires firms to spend time and money posting current prices in catalogues, menus, and on ticketed merchandise. • Shoe Leather Costs • Inflation increases the cost of managing cash balances.
Shoe Leather Costs • Shoe leather cost refers to the cost of time and effort (more specifically the opportunity cost of time and energy) that people spend trying to counter-act the effects of inflation, such as holding less cash and having to make additional trips to the bank. The term comes from the fact that more walking is required (historically, although the rise of the Internet has reduced it) to go to the bank and get cash and spend it, thus wearing out shoes more quickly. The actual cost of reducing money holdings is the additional time and convenience that must be sacrificed to keep less money on hand than would be required if there were no inflation.
Inflation: Grease or Sand? Sand Low inflation may stimulate growth, but inflation over 3% may reduce growth. Inflation (%) 9 6 3 Grease Growth
Why Some Unemployment is Necessary • Flows In and Out of the Labor Market • About 10 million people change their job status every month. • Vacancies • Vacancies arise when workers leave their jobs and/or new jobs are created. • Labor Market as a Matchmaker • The labor market is not an instant matchmaker between unemployed workers and job vacancies
Flows In and Out of the Labor Market Employed 127.3 Million 2 million 1.7 million 3 million 3.5 million 1.2 million Not in Labor Market 66.8 Million Unemployed 6.7 Million 1.7 million
Supply and Demand for Labor Point A represents labor market equilibrium with no search costs. SM Real Wage S B Point B represents equilibrium with search costs. N2-N1 is frictional unemployment. A We D DM N1 N2 Employment
Supply and Demand for Labor with Above Equilibrium Wages SM Real Wage S W1 Above equilibrium wages cause insider-outsider unemploymentNS2-ND1. B A We D DM ND1 N1 N2 ND2 Employment
Why are Wages Above Equilibrium? • Unionsmay exert pressure for higher wages. • The government may impose a minimumwagethat is above the equilibrium wage. • Efficiency wagesare above equilibrium wages paid to attract and retain the best workers.
Strategies to Lower European Unemployment • Improve labor force skills with education and training • Reform employment security laws • Reduce regulation of work time and temporary jobs • Reform the level and duration of unemployment benefits
The Natural Rate of Unemployment • The natural rate of unemployment is the sum of frictional and insider-outsider unemployment. • The natural rate of unemployment has decreased 0.6 to 1.1 percentage points from the mid 1980s to the late 1990s.
Cyclical Unemployment • Cyclical unemployment occurs when real output is below potential output. • Cyclical unemployment exists because of coordination failures. • Problems that develop in an economy because decisions by individuals feed back into the economy, augmenting the effect of the initial decision.
The Business Cycle in the Labor Market Recessions cause a decrease in the demand for labor from D to D1 Real Wage S The wage rate remains the same in the short-run, and employment falls to N1. We D D1 N1 N Employment
Cost of Cyclical Unemployment • The cost of cyclical unemployment is the difference between actual output and potential output. • Okun’s Rule of Thumb describes the relationship between unemployment and growth in GDP.
Okun’s Rule of Thumb %Q = 3.5 - 2 U %Q is the percent change in real GDP U is the change in the unemployment rate
Equity Costs of Unemployment • For individuals the costs of unemployment include lost income, a decline in skills, and loss of self-worth. • Unemployment is not shared equally among demographic groups • Teenage unemployment is higher than the overall unemployment rate. • The unemployment rate for blacks and Hispanics is higher than for whites.
The Phillips Curve The Phillips curve represents a short-run trade off between inflation and unemployment. If policy makers choose to reduce unemployment from 8% (B) to 4% (A) the cost may be an increase in inflation from 3% to 7%. Inflation Rate (%) A 7% B 3% 4% 8% Unemployment Rate (%)
Inflation and Unemployment 1954-2000 • The Phillips curve which shows the historical relationship between inflation and unemployment has not remained stable over time. • Between 1958 and 1969, an inverse relationship between unemployment and inflation did exist.
Inflation and Unemployment 1954-2000 • Between 1970 and 1984, the inverse relationship broke down. Both inflation and unemployment were high in those years. • The inverse relationship between inflation and unemployment reappeared between 1985 and 1992, but disappeared again in 1992 when inflation and unemployment both decreased.
Short-Run and Long-Run Phillips Curves There are two Phillips curves: A long-run Phillips curve which is vertical at the natural rate of unemployment. Long-Run Phillips Curve Inflation A short-run Phillips curve that shifts along the long-run curve. Short-Run Phillips Curve Natural rate of Unemployment Unemployment
Short-Run and Long-Run Phillips Curves • The long-run Phillips curve shows that policymakers cannot reduce unemployment below the natural rate by accepting more inflation. • The short-run Phillips curve represents a tradeoff between inflation and unemployment that changes as the curve shifts.
Sacrifice Ratio • The sacrifice ratio is the annual percentage point loss of output for every percentage point decline in the annual inflation rate. • The sacrifice ratio during the early 1980s was 2.3.