Download
1 / 50
500 likes | 759 Vues
Hydrology – Turning Rainfall in to River Flow. Ross Woods NIWA Christchurch r.woods@niwa.co.nz. Context. Second of 3 river-related talks Hydrology Stats (“how much - how often?”) From Rainfall to River Flow (“how does it work?”) Inundation (“how deep?”). Outline.

E N D
Hydrology – Turning Rainfall in to River Flow Ross Woods NIWA Christchurch r.woods@niwa.co.nz
Context • Second of 3 river-related talks • Hydrology Stats (“how much - how often?”) • From Rainfall to River Flow (“how does it work?”) • Inundation (“how deep?”)
Outline • Introduction: Hydrological Cycle • How Floods Happen: Hydrological Processes • Not All Floods are the same • Different types of rivers – classification • Storms change over time, and in space • Flood Analysis for Design and Forecasting
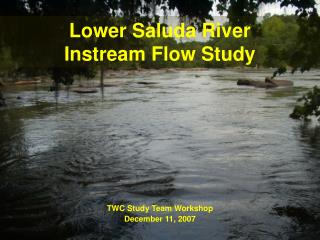
Clutha River November 1999 Insurance Payout: $46 million If we understand floods, we can plan better, and forecast better
Manawatu Feb 2004 http://www.ourregion.co.nz
1. Introduction: Hydrological Cycle and Catchment • Concept of a catchment • Most of the time, things happen slowly • During a flood, some parts of the cycle are very active
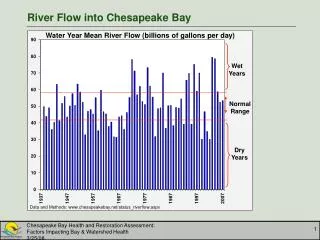
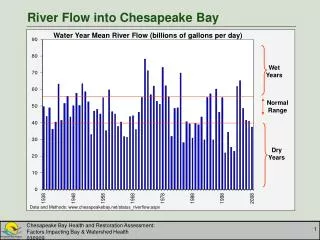
Annual Runoff and Rain Rainfall River Runoff
Month of the Year with Most Flow Data sources: NIWA, RCs, Energy industry
2. Hydrological Processes for Floods • Can look at this at several scales (kilometres, metres, mm) – we will think at kilometres and metres. • Kilometre scale – headwaters generate flood runoff, and the lower reaches of the river transport these floods
Kilometer-scale Hydrological Processes Waimakariri
Kilometre-scale Hydrological Processes Floodplain fed by Mountain RunoffOrographic Rainfall Processes
Flood Generation & Routing Heavy rain falls for long enough, over a wide enough area, some of it runs off into streams, and travels down the river network Flow (m3/s) Upstream Downstream Flow (m3/s) Time Time Time
Hillside Stream Cross-section Metre-scale Hydrological Processes for Floods - 1 • Infiltration Excess Runoff – It rains so hard that water can’t get into the soil, and instead produces flood runoff • Affected by soil type, land cover, urbanisation • Quantified by soil hydraulic conductivity
Hillside Stream Cross-section Metre-scale Hydrological Processes for Floods - 2 • Saturation Excess Runoff – there’s so much rain that there’s no room in the soil to store it, so it produces runoff • Affected by time of year, vegetation, soil thickness, position on slope • Quantified by soil water deficit, and locally by soil-topographic index
Hillside Cross-section Metre-scale Hydrological Processes for Floods - 3 • Subsurface stormflow – water moves through the soil so quickly that it can make floods. • Affected by steepness, vegetation, soil depth Stream
3. Not All Floods are the same – River Types • The two most important factors controlling flood size are the climate and the area of catchment (km2) • Catchment area – Small vs Large, from a few hectares up to more than 10,000 km2 • Climate - Dry vs wet, ranging from 400 mm/y in Central Otago to more than 10,000 mm/y in Alps • These two factors are important in many flood estimation methods. • Other factors can come into play, depending on location: geology, urban drainage, vegetation, topography, river network, seasonality
Mountain – Large, Wet At kilometre scale, orographic rainfall processes are very important At metre scale, subsurface stormflow is the key runoff generation process here
Lowland – Smaller, Drier More likely to be affected by convective rain At metre scale, saturation excess runoff is the key runoff generation process here
3. Not All Floods are the same – Time variation • Within-storm variability • Between-storm variability – (seasonal differences, also mention storm depth )
Rainfall-Runoff Response Flow is more damped than rain because of catchment averaging Delay between rain peak and flow peak because of travel distances in catchment Rain (mm/ 15 mins) Flow (l/s)
3. Not All Floods are the same – Space variation • Within-catchment variability of rain, slope, vegetation, location in river network
Rain Varies From Place to PlaceFloods are very senstitive to this Weather radar image, 200km across Weather radar image, 15 km across
Waipaoa Catchment Soil Properties Soils that hold less water make bigger floods
Waipaoa Catchment Land Cover Floods tend to be smaller in forested areas, other things being equal
Waipaoa Catchment Topography and River Network River networks control timing of floods from the different sub-catchments Steeper land can hold less water in the soil
4. Typical Flood Analyses • Design Flood Estimation – what is the flood that will typically only occur once in 50 (100) years? Used for planning, especially flood protection measures. Two commonly-used methods • Rainfall-runoff models (e.g. Rational Method) • Regional Flood Estimation (Charles covered this) • Flood Forecasting – how big will tomorrow’s flood be? Used for forecasting, and also as a mitigation measure where protection is tricky • Rainfall-runoff models (same as above) • Flood routing models
Rainfall-runoff Models – 1 • Rational method – just estimates the peak • Often used for small-catchment design • Q = c i A / 3.6 • Q – flood peak (m3/s) • c – runoff coefficient (dimensionless – local knowledge!) • i – “1 in T year” rainfall intensity for appropriate duration (mm/h - HIRDS), minus “losses” • A – area of catchment (km2)
Example: Wanaka • Need design flood of various return periods for a small stream in subdivision (area 2 sq km) • Get duration from textbook, design rainfalls from HIRDS, & c from MWD culvert design manual OtagoRC
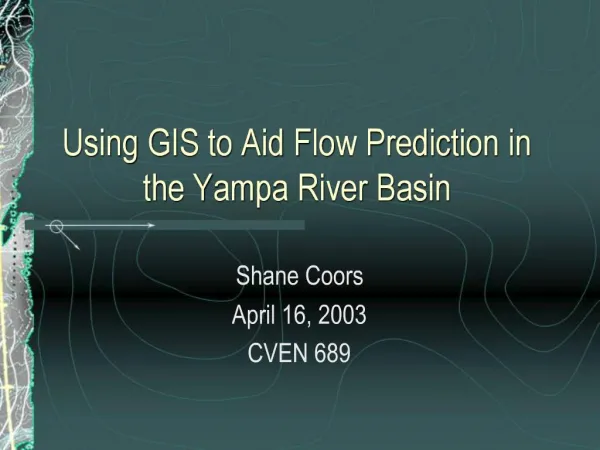
Rainfall-runoff Models - 2 • Distributed water balance model - Topnet – estimates the hydrograph at many places – more detail coming up … • Requires GIS data and rainfall information at many places • Useful for large rivers, with variety of subcatchments especially those where flow measurments are sparse • Good where rain is spatially variable, catchments are a complex spatial mixture, or physical interpretation of processes is important - e.g. climate change
Other sub-basins: each one is unique Canopy Snowpack Root zone Sat. zone TOPNET - 1 Rain, Temperature, Evap Snowmelt Throughfall Surfaceflow Topo. controls Sub-basinoutflow River Network Recharge Subsurfaceflow
TOPNET - 2 • Sub-basin outflows are connected to river network routing (kinematic waves) • Model gives results for every sub-basin and every river reach, every day • Preprocessing software builds the model • uses DEM to automatically define river network and sub-basins at user’s chosen level of detail • calculates average values within each subcatchment for soil, vegetation & climate parameters
NorthlandRunoff Hydrographs & Maps Model uses hourly/daily rainfall: e.g. NZLAM, RAMS, telemetered raingauge, radar, CLIDB
TopNet: River Basin Flow Forecasts – EcoConnect Component • EcoConnect is Environmental Forecasting: weather, tide, storm surge, currents, sea surface height, river flow, inundation • Rain forecast from weather model • Specific rivers with Env BoP, Gisborne DC, Marlborough DC, Otago RC
Flood Routing Models • Translation Routing – uses measurements of flow at upstream site(s), and estimate of travel times. The simplest – there are more complex options (kinematic waves, etc) • Q(t) = a.U(t-da) + b.V(t-db) • Useful for large rivers which are not very flat, provided upstream flow measurments are adequate • Many alternatives, if suitable data are available – kinematic waves, St Venant equations
Translation Routing on the Mataura River • Provides 16 hours reliable warning because • Most floods begin in the headwaters & are measured • Travel times from headwaters are long Env. Southland
Models, models, models • There are lots (too many!) hydrological models. Hydrologists are gradually reducing this as the science matures • Model selection depends on river type, and on data availability, and on your goal!
Important Issues that Affect Floods • Climate Change may cause increased flood magnitude over next 30-100 years, and may change the balance of rain vs snow (more rain, less snow) • Climate Variability does cause changes in flood risk between decades (risk goes up and down, differently in different parts of NZ) • Urbanisation of a catchment does increase flood risk, because it prevents rain from infiltrating, and it transports water very quickly • Removal of forests from large portion of a catchment may increase flood risk, because forests can keep the soils drier, and so provide more space in the soil to hold rain during storms.
Buller - Climate Change & Floods Storm Rainfall Increases Flood Peak Almost Doubled Now Now 2080 2080 vs Now MfE, BullerDC
Issues I Haven’t Covered • Urban Drainage Modelling • Reservoir modelling (floods and dams) • Effect of Flood Mitigation – stopbanks etc • Modelling of soil water, landslides • Effects of floods on contaminants (sediments, heavy metals)