Download
1 / 36
360 likes | 465 Vues
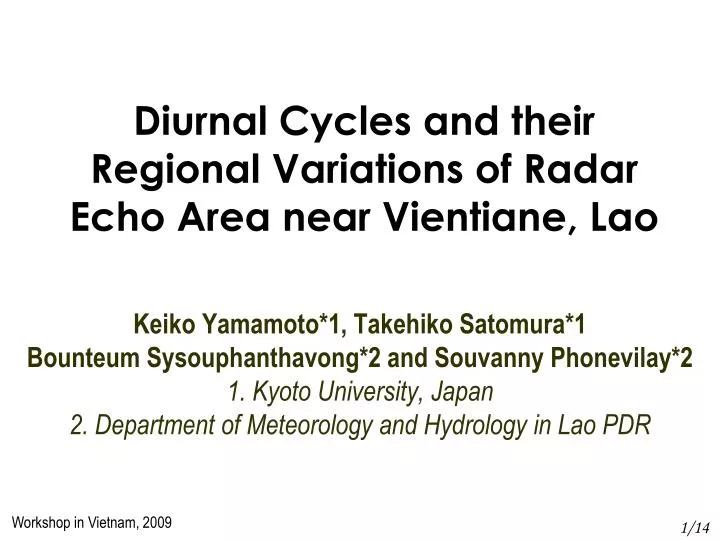
Diurnal Cycles and their Regional Variations of Radar Echo Area near Vientiane, Lao. Keiko Yamamoto*1, Takehiko Satomura*1 Bounteum Sysouphanthavong*2 and Souvanny Phonevilay*2 1. Kyoto University, Japan 2. Department of Meteorology and Hydrology in Lao PDR. Workshop in Vietnam, 2009. 1/14.

E N D
Diurnal Cycles and their Regional Variations of Radar Echo Area near Vientiane, Lao Keiko Yamamoto*1, Takehiko Satomura*1 Bounteum Sysouphanthavong*2 and Souvanny Phonevilay*2 1. Kyoto University, Japan 2. Department of Meteorology and Hydrology in Lao PDR Workshop in Vietnam, 2009 1/14
Onset and withdrawal of rainy season Onset Offset Matsumoto (1997) 2/14
Wind direction during rainy season Averaged wind at 850 mb Southwesterly governs at 1000 mb (not shown) Matsumoto (1992) 3/14
: the infrared-1 channel black body temperature : the water vapor channel black body temperature Diurnal variations of convective activity Ohsawa et al. (2001) used GMS satellite data and investigated when the diurnal variations of convective activity have their peak over the Indochina Peninsula. They defined as an index. Where The convective activity gets strong when 4/14
sea land Diurnal variations of convective activity Time of maximum convective activity over Indochina Peninsula (averaged over JJA) Late night-early morning maximum: ※ Near Vientiane: 3 LT What brings this night maximum? -> Not known yet Ohsawa et al. (2001) ※:Vientiane 5/14
Preface + Not enough ground-based observation has been done near Vientiane -> Meteorological radar was built in 2007 -> Time has come! + In tropics, convective activity shows outstanding diurnal variation over the continent (Nitta and Sekine, 1994) -> Analyzing the diurnal cycle of convective activity is on the top of the must-do list + Time of the maximum convective activity is around midnight near Vientiane (Ohsawa et al., 2001) -> Mechanism is not known yet Meteorological radar located at Vientiane brings us 2-dimensional ground-based observation. Using this radar, diurnal cycles and their regional variations were analyzed. 6/14
Data Radar observation range 400 km obs. twice (elevation 0.5, 1.3 degree) 120 km obs. 12 times (elevation 0.5 ~ 22.9 degree) Interval: 7.5 minutes Analysis period: Apr 1 – Oct 23, 2008 Spherical coordinate ↓Weighted interpolation Cartesian coordinates Outer circle:400 km , inner circle:120 km 7/14
CAPPI (3 km height) Shadow Blocked Data After the interpolation, Constant Altitude PPI (CAPPI) was made at 3 km height Analysis went through using this CAPPI Contour: every 500 m 8/14
Time series variations of radar echo area July, 2008 Horizontal axis: Day black solid line: 0 LT Grey tone: missing obs. Above: over 10 dBZ Below: over 30 dBZ July, 2008 Over 10 dBZ: there exists long life precipitation Both figures: night time precipitation is outstanding in July 9/14
Middle of rainy season Offset Onset Apr, 2008 Jul, 2008 Oct, 2008 (LT) (LT) (LT) 0 6 18 24 0 18 24 0 6 18 24 12 6 12 12 Diurnal cycles of radar echo area Bar graph: radar echo area of the intensity of over 10 dBZ (left vertical axis) Solid line: averaged area of one convective system (right vertical axis) Horizontal axis: local time Radar echo area maximum in the afternoon: contribution of numbers of small convective systems Radar echo area maximum at night in July: contribution of some large convective systems 10/14
Jul, 2008 6 5 4 3 2 1 0 12 18 6 12 (LT) • See the results of two cases: • consider small systems only. • consider large systems only. Threshold: Regional differences of diurnal cycles The phase of the diurnal cycles shifts over the downstream of mountains. divided into 6 regions Solid lines: diurnal cycles of echo area Horizontal axis: local time 106 km 11/14
12 12 12 12 18 18 0 0 6 6 Regional differences of diurnal cycles Large systems only Small systems only Jul, 2008 Jul, 2008 Suppose that convective systems propagate to northeast -> phase speed is 13-16 m/s The phase shift of diurnal cycles cannot be seen Time of the maximum: in the afternoon -> small systems are generated locally and disappear shortly Time of the maximum gets late as it goes to northeast -> This result indicates the existence of northeastward convective systems 12/14
Ratio of radar echo existence Time-Distance cross section Averaged over July, 2008 Domain: 600 km x 20 km 00 18 12 B 06 00 18 12 06 00 A B A Above Tone:diurnal cycles of the ratio of echo exis-tence in the domain Horizontal axis:distance Vertical axis:LT (diurnal cycle twice) Below Horizontal axis:distance Vertical axis:averaged elevation in the domain Circles: 100 km, 200 km, 300 km Contour: every 500 m Echo propagates northeastward speed: 12-15 m/s 13/14
Conclusions + Diurnal cycles Apr and Oct: in the afternoon -> numbers of small systems Jul: around 1 LT + Night time precipitaion in July Large convective systems: It appears that there exists northeastward convective systems Phase speed / traveling speed: 12-16 m/s Similar to the phase speed of cloud streaks observed in East Asia (Wang et al., 2004) and North Africa (Laing et al., 2008); 10-25 m/s. It suggests that northeastward convective systems bring the night time rain near Vientiane. Consider the speed, squall line would have a part in the mechanism. 14/14
squall line スコールライン型 中層(850 hPa-550 hPa) の相当温位が低く、対流不安定性強い ラインの先端部に活発な積乱雲が並ぶ convective region 背後に中層から上層にかけてメソスケールに広がった stratiform region がある(100 km の範囲になることもしばしば) ストームの前面からストーム内に空気は流入 メソ気象&Zipser 1982
squall line スコールライン型 中層(850 hPa-550 hPa) の相当温位が低く、対流不安定性強い
squall line メソ対流系ー団塊状ー組織化されていないマルチセル型 (気団性雷雨) ー組織化されたマルチセル型 -スーパーセル型 -メソスケール対流複合体(MCC) -線状ースコールライン型 (急行型:鉛直シアに直交型)15 m/s -非スコールライン型 (鈍行型:鉛直シアに平行型) (降雨バンド型) MCS は 20 km - 500 km 水平あれば affirmative
Based on Japanese criteria 10 dBZ -> 0.15 mm/hr don’t need an umbrella 20 dBZ -> 1.5 mm/hr may need an umbrella 30 dBZ -> 2.7 mm/hrneed an umbrella 40 dBZ -> 11.5 mm/hrstrong rain 45 dBZ -> 23.7 mm/hrrain cats and dogs 50 dBZ -> 100 mm/hrfear the rain
64 個の各小領域に存在する エコーが次のタイムステップで どの方角に移動したか 相互相関係数(水越・里村, 1999) を用いて調べ、 移動ベクトル 64 個を算出 エコー面積の移動方向と大規模風の風向 40 km 四方 320 km 320 km 12/17
E E Jul, 2008 S S W W N N E E 10 15 20 5 25 30 Radar echo coming direction LeftHorizontal axis:Day (black solid lines:0 LT) Tone: ratio of radar echo coming direction Marks: NCEP Reanalysis data ○: 1000 hPa, ×: 850 hPa, □: 600 hPa Vertical axis: direction Right Horizontal axis: ratio of echo coming direction Vertical axis: direction 7 月について: 1000 hPa 面では大規模風は南西風 高度 3 km CAPPI 上のエコーは 850 hPa - 600 hPa の 中層の大規模風の風向(西・南西・北西)に沿ってやってくる 13/17
エコー反射強度の時間-距離断面図 2008 年 7 月 18 日 - 20 日 南西-北東に細長い 600 km x 20 km の領域 B A 円:内側から 100km, 200km, 300km 上 トーン:AB の領域内でのエコー反射強度 横軸:距離 縦軸:現地時刻 (横縞線:欠測期間) 下 横軸:距離 縦軸:AB の領域内の平均標高 16/17
欠測頻度 2008年 4 月 2008年 5 月
欠測頻度 2008年 6 月 2008年 7 月
大きい対流システム 小さい対流システム
A ......... ......... a1n b1n a11 b11 ……… ……… ……… ……… P ......... ......... an1 bn1 bnn ann A B P Q (a) L km t = T L km (b) t = T + dT :echo
JUL/AUG :1800 LT :0000 LT :0600 LT 対流活動の日変化の位相のずれ Riley et al. (1987) はロッキー山脈と その東側の平野に設置された雨量計 を用いて降水の日変化を調べた 日変化の極大時刻 (LT) を表したのが 右図 (解析期間:JUL/AUG; 1948-1983) ND SD MT WY MN IA NE CO UT →極大時刻が東にいくほど遅い KS Tripoli and Cotton (1989) は二次元 数値実験を行い、コロラド州山岳域で発生したメソスケール対流システム (MCS) が東進し、東の平野で夜に雨をもたらすことを再現 また、彼らは MCS の形成に南西モンスーンが重要であることを示唆 AZ NM OK TX Riley et al. (1987) 7/17
対流活動の日変化の位相のずれ 夜雨が顕著 → 中緯度では夏期における Great Plains が知られている Riley et al. (1987) はロッキー山脈とその東側の平野に設置された雨量計 を用いて降水の日変化を調べた → 日変化の極大時刻が東にいくほど遅い Tripoli and Cotton (1989) は二次元 数値実験を行い、コロラド州山岳域で発生したメソスケール対流システム (MCS) が東進し、夜に東の平野に到達することを再現 また、彼らは MCS の形成には季節風である 南西モンスーンが重要であることを示唆 Google map 7/17
: black body temperature Horizontal distribution of convective activity Nitta and Sekine (1994) defined as follows The activity is outstanding during July over the Indochina Peninsula Nitta and Sekine (1994) 4/16
Horizontal distribution of convective activity Amplitudes of diurnal components of Large diurnal variations: -> over the continent -> near large islands Understanding diurnal variations is of the essence Nitta and Sekine (1994) 5/16