Download
1 / 25
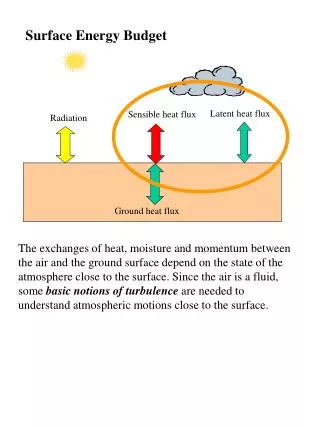
250 likes | 406 Vues
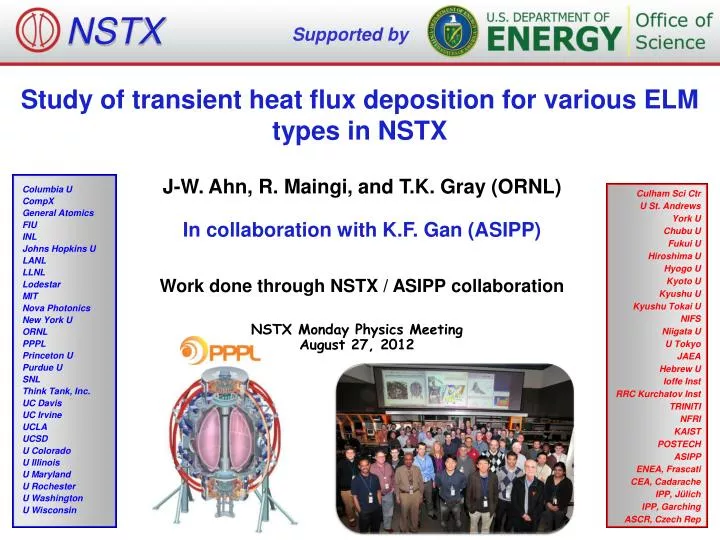
NSTX. Supported by. Study of transient heat flux deposition for various ELM types in NSTX. J-W. Ahn , R. Maingi, and T.K. Gray (ORNL) In collaboration with K.F. Gan (ASIPP) Work done through NSTX / ASIPP collaboration. Columbia U CompX General Atomics FIU INL Johns Hopkins U LANL LLNL

E N D
NSTX Supported by Study of transient heat flux deposition for various ELM types in NSTX J-W. Ahn, R. Maingi, and T.K. Gray (ORNL) In collaboration with K.F. Gan (ASIPP) Work done through NSTX / ASIPP collaboration Columbia U CompX General Atomics FIU INL Johns Hopkins U LANL LLNL Lodestar MIT Nova Photonics New York U ORNL PPPL Princeton U Purdue U SNL Think Tank, Inc. UC Davis UC Irvine UCLA UCSD U Colorado U Illinois U Maryland U Rochester U Washington U Wisconsin Culham Sci Ctr U St. Andrews York U Chubu U Fukui U Hiroshima U Hyogo U Kyoto U Kyushu U Kyushu Tokai U NIFS Niigata U U Tokyo JAEA Hebrew U Ioffe Inst RRC Kurchatov Inst TRINITI NFRI KAIST POSTECH ASIPP ENEA, Frascati CEA, Cadarache IPP, Jülich IPP, Garching ASCR, Czech Rep NSTX Monday Physics Meeting August 27, 2012
Motivation • Engineering limit of steady state peak heat flux is generally ~10 MW/m2 • Transient heat flux from large ELMs is a great threat to the protection of divertor plates for ITER and other future devices • It is possible that only small ELMs may be allowed • NSTX-U will be in higher Ip and heating power with longer pulse length, therefore ELM heat flux problem will be much more serious • Need to understand heat deposition for various ELM types in NSTX • Possibility to extrapolate to or predict ELM heat flux in NSTX-U and • future ST device First systematic investigation of ELM heat flux from IR measurement in NSTX
IR camera diagnostics for heat flux measurement • Divertor surface temperature is monitored by fast IR camera • Single band (8-12 μm) fast IR camera in 20091 • – Spatial resolution: 1.7 mm • – Temporal resolution: 1.6 – 6.3 kHz • Dual band (4-6μm and 7-10 μm) IR adapter in 20102 • – For lithiated PFC surface, 1.6kHz frame speed • Heat flux calculation from the measured surface temperature • – 1-D radial heat flux profile from THEODOR3 • – 2-D (r, Φ) heat flux profile from TACO4, • improved to incorporate thin surface layer effect5 1J-W. Ahn, RSI 81 (2010), 023501, 2A.G. McLean, RSI 83 (2012), 053706 3Collaboration with IPP Garching, A. Hermann 4G. Castle, COMPASS Note 97.16, UKAEA Fusion (1997) 5K.F. Gan, submitted to RSI (2012)
Outline • Study of transient ELM heat flux1 – temporal and spatial evolution of peak heat flux and heat flux width • - Type-V ELMs • - Type-III ELMs with high and low bp • - Type-I ELMs • - Relationship between qpeak and lq • 2-D heat flux data produced by TACO (through collaboration with MAST Team), now upgraded to take account of thin surface layer effect 1 K.F. Gan, submitted to NF
TACO calculates 2-D heat flux distribution at divertor surface Surface heat flux Calculated 2-D heat flux Measured surface temperature Negative heat flux; Non-physical • 2-D (r, Φ) heat flux data are obtained from TACO • Analysis results from 1-D radial profile data are presented here but 2-D data are also being analyzed for the ELM and 3-D physics study
The effect of thin surface layer on heat flux calculation Thin surface layer Incident heat flux Bulk PFC material (k, ρ, cp) • Thin layer of hydrocarbon composite often forms on the surface of PFC material • Low thermal conductivity with poor thermal contact with the PFC substrate underneath • IR emission is much brighter when a heat pulse hits the surface than it should be w/o thin layer interpreted as much higher temperature rise than real Excessively high heat flux computed to explain this DTsurf • Also, the surface layer makes the drop of surface IR emission excessively rapid after the heat pulse • interpreted as a rapid Tsurf drop Solution of heat conduction equation yields negative heat flux to accommodate this temperature change
Implementation of heat transmission coefficient in TACO alleviates negative heat flux problem a: Heat transmission coefficient1 klayer: surface layer thermal conductivity, d: surface layer thickness Surface heat flux with a incorporated in heat conduction equation Calculated 2-D heat flux with no a Calculated 2-D heat flux with a = 60 (kWm-2K-1) • With a implemented in the heat conduction equation, negative heat flux problem is alleviated. This also lowers the computed peak heat flux 1 A. Herrmann, PPCF (1995) International collaboration on THEODOR with IPP-Garching
Choice of a value is made by comparing several values of deposited energy from different a NSTX • The a value makes a large influence on the heat flux calculation, and different values lead to very different results • In NSTX, we choose the a value that keeps the deposited energy constant after the discharge
Comparison of new TACO calculation and THEODOR with same a value Peak heat flux evolution Heat flux profile • Comparison of 1-D radial profile results from TACO to those from THEODOR • Good agreement for both the temporal evolution of peak heat flux and the • spatial heat flux profile at a specific time slice
Outline • Study of transient ELM heat flux1 – temporal and spatial evolution of peak heat flux and heat flux width • - Type-V ELMs • - Type-III ELMs with high and low bp • - Type-I ELMs • - Relationship between qpeak and lq • 2-D heat flux data produced by TACO (through collaboration with MAST Team), now upgraded to take account of thin surface layer effect 1 K.F. Gan, submitted to NF
Characteristics of several ELM types in NSTX • Type-I ELMs: • plasma stored energy (WMHD) • drop by up to ~10 % • Type-III ELMs: • 1-3 % drop of WMHD • Type-V ELMs: • Less than 1 % drop of WMHD, • individual Da peaks are • usually undiscernible Type-I Type-III Type-V Mixed Type-I / Type-V Maingi, NF 2005
Summary of qpeak and lint change during ELMs and ELM-free phase • lint increases for all ELM types relative to the value for ELM-free phase
Transient heat flux for type-V ELMs Separatrix (1) Integral mid-plane heat flux width (2) (2) (3) (1) (3) • Heat flux profile during ELM has multiple local peaks exponential fitting can’t characterize heat flux width well Integral heat flux width lint • Evolution of heat flux profile shows that additional heat flux by ELM filaments mainly occurs in a zone displaced into SOL from original strike point profile broadens
Transient heat flux for type-V ELMs Separatrix Type-V ELMs (1) (2) (2) (3) (1) (3) • Heat flux profile during ELM has multiple local peaks exponential fitting can’t characterize heat flux width well Integral heat flux width lint • Evolution of heat flux profile shows that additional heat flux by ELM filaments mainly occurs in a zone displaced into SOL from original strike point profile broadens • Each type-V ELM increases qpeak by 20 – 50% and lint by ~20%
Comparison of heat deposition pattern during type-V ELMy to ELM-free phases L-H transition Type-V ELMs ELM-free • During the ELM-free phase, qpeak increases andλint rapidly decreases • total deposited power is • somewhat constant • During the type-V ELMy phase, qpeak decreases and λint increases • deposited power is again • constant 132406
Transient heat flux for type-III ELMs • 132401 • Ip=600kA, PNBI=4MW High bp • 132460 • Ip=700kA, PNBI=2MW Low bp
Heat deposition for type-III ELMs with low bp (1) (2) 273.279ms 273.438ms 273.597ms 273.756ms 273.915ms 275.505ms (2) (3) (1) (3) • ELM filamentary deposition of heat flux is distributed farther (4-5 cm) from the strike point. The profile then slowly reverts to the peak near SP during the ELM recovery phase • During inter-ELM period, lint grows and qpeak decreases • Each type-III ELM increases both qpeak (by ~100%) and lint (by ~20%)
Heat deposition for type-III ELMs with high bp (1) (2) (2) (3) (3) (1) • ELM filaments increase the heat flux 7-8 cm away from original strike point but the peak heat flux reverts back to the strike point afterwards • During inter-ELM periods, lint rebuilds slowly to the nominal value of ~3 cm • Type-V ELMs are present between ELM peaks and they increase lint • Each type-III ELM increases qpeak by a factor of 4 – 6 and decreases lint by ~50%
Heat deposition for type-I ELMs (1) (2) (2) (3) (3) (1) • ELM filaments increase the peak heat flux a few cm away from the original strike point but the peak heat flux reverts back to the strike point afterwards • Similar behavior to type-III ELM with high bp • Each type-I ELM increases qpeak by up to 1000% and decreases lint by 30-40%
Summary of qpeak and lint change during ELMs and ELM-free phase • lint increases for all ELM types relative to the value for ELM-free phase
Relationship between qpeak and lint for all ELM types • Relationship between qpeak and lint at ELM peaks for multiple shots • Overall inverse relationship observed between qpeak and lint not good trend for future machine • No clear correlation for Type-V alone • Type-V and type-III appear to follow same trend together • Some type-III ELM lint values for large qpeak (> 5-6 MW/m2) are smaller than for type-I ELMs!! Type-V Type-III Type-I • A strong inverse relationship is observed in the lowest range of qpeak for type-I • Acceptable regime might exist below qpeak~5 MW/m2 ?? • lint saturates for largest values of qpeak (> 10MW/m2) for type-I
Summary and conclusions • TACO has been implemented to generate 2-D heat flux data with surface layer effect taken into account • – Choice of surface heat transmission coefficient (a) greatly affects heat • flux calculation. A value to keep the deposited energy constant after • discharge is chosen in NSTX • Temporal and spatial variation of qpeak and lq during three types of ELMs (type-V, type-III, and type-I) have been investigated • − Type-V ELMs: Both qpeak and lq increases during each ELM. • qpeak decreases and lq increases during type-V ELMy phase • − Type-III ELMs: Both qpeak and lq increase during each ELM for low bp. • qpeak increases and lq decreases for high bp. • − Type-I ELMs: qpeak increases and lq decreases during each ELM • Inverse relationship is generally observed between lq and qpeak. More work needed to characterize ELM heat flux behavior with underlying physics • 2-D ELM heat profile analysis is underway using TACO data
Choice of a value is made by comparing several values of deposited energy from different a G De Temmerman, PPCF, 52 (2010) 095005 (14pp) MAST • Several techniques to determine optimal a value • In MAST, comparison of deposited energy from IR measurement with the energy derived from the power balance is used
Transient heat flux for type-I ELMs • Type-I ELMs: • Up to 10% loss of plasma stored energy and large transient heat load
Transient heat flux for type-V ELMs Type-III ELMs Type-V ELMs • Type-V ELMs: • Small ELM with < 1% drop in plasma stored energy