Populations & Samples
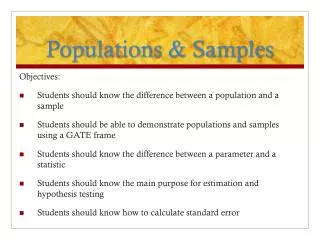
Populations & Samples. Objectives: Students should know the difference between a population and a sample Students should be able to demonstrate populations and samples using a GATE frame Students should know the difference between a parameter and a statistic

Populations & Samples
E N D
Presentation Transcript
Populations & Samples Objectives: • Students should know the difference between apopulationand asample • Students should be able to demonstrate populations and samples using a GATE frame • Students should know the difference between a parameter and a statistic • Students should know the main purpose for estimation and hypothesis testing • Students should know how to calculate standard error
GATE Frame: Populations & Samples A population is any entire collection of people, animals, plants or objects which demonstrate a phenomenon of interest. Population A sample is a subset of the population; the group of participants from which data is collected. Eligible In most situations, studying an entire population is not possible, so data is collected from a sample and used to estimate the phenomenon in the population. Sample/ Participants
Parameters & Statistics A population value is called a parameter. A value calculated from a sample is called a statistic. Note: A sample statistic is a point estimate of a population parameter.
Estimating Population Parameters Confidence intervals (CI) are ranges defined by lower and upper endpoints constructed around the point estimate based on a preset level of confidence. Hypothesis Testing is used to determine probabilities of obtaining results from a sample or samples if the result is not true in the population.
Sample Estimates of Population Parameters Sample Statistic (point estimate) Population Parameter L = lower value U = upper value Combine with measure of variability of the point estimate Construct a range of values with an associated probability of containing the true population value
What is Standard Error? Suppose a population of 1000 people has a mean heart rate of 75 bpm (but we don’t know this). We want to estimate the HR from a sample of 100 people drawn from the population: n=100 Population N=1000 We draw our sample, and the mean HR is 72 bpm
Standard Error If we draw another sample, the mean will probably be a little different from 72, and if we draw lots of samples we will probably get lots of estimates of the population mean: n=100 n=100 n=100 n=100 n=100 n=100 Population N=1000
Standard Error The mean of the means of all possible samples of size 100 would exactly equal the population mean: All possible samples of sizen=100 Population N=1000 The standard deviation of the means of all possible samples is the standard error of the mean
Sample Representativeness The sample means will follow a normal distribution, and: 95% of the sample means will be between the population mean and ±1.96 standard errors.
Population Mean Sample Means In addition, if we constructed 95% confidence intervals around each individual sample mean: 95% of the intervals will contain the true population mean.
Why is This Important and Useful? We rarely have the opportunity to draw repeated samples from a population, and usually only have one sample to make an inference about the population parameter: The standard error can be estimated from a single sample, by dividing the sample standard deviation by the square root of the sample size: Note: You will need to calculate the standard error in this course.
Standard Error and Confidence Intervals The sample SE can then be used to construct an interval around the sample statistic with a specified level of confidence of containing the true population value: The interval is called a confidence interval The Most Commonly Used Confidence Intervals: 90% = sample statistic + 1.645 SE 95% = sample statistic + 1.960 SE 99% = sample statistic + 2.575 SE