Download
1 / 23
240 likes | 363 Vues
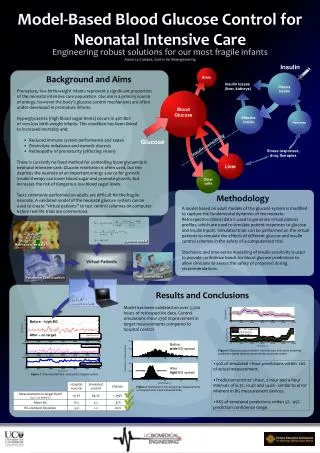
The NOAA/AOML has implemented a real-time quality control process for Argo floats, ensuring high-quality oceanographic data regarding temperature and salinity. This process involves uniform data management, accessibility, and timely provision, while applying rigorous quality control measures to eliminate anomalous data. Key criteria include automated detection of impossible values, spikes, and gradients. The goal is to provide accurate profiles to the international oceanic research community, contributing to understanding of ocean dynamics and improving operational standards.

E N D
Argo Real-time Quality Control Process NOAA/AOML: Y.-H. DANESHZADEH, R. MOLINARI, R. SABINA, C. SCHMID CIMAS/UM: E. FORTEZA, X. XIA, H. YANG
Guiding Philosophy of the international real-time DACs • PROVIDE TO THE INTERNATIONAL OPERATIONAL AND RESEARCH • OCEANIC COMMUNITIES PROFILES OF TEMPERATURE AND SALINITY • RESULTING FROM ARGO FLOATS THAT MEET THE FOLLOWING • CRITERIA: • DATA HAVE BEEN MANAGED IN A UNIFORM MANNER • DATA ARE FREE • DATA ARE READILY ACCESSIBLE • DATA ARE AVAILABLE WITHIN A TIMELY MANNER • DATA HAVE BEEN QUALITY CONTROLLED TO REMOVE THE MOST EGREGIOUS ERRORS • COST OF REAL TIME QUALITY CONTROL IS REASONABLE
Atlantic Data Coverage Positions of the floats that have delivered data within the last 30 days
Automatic quality control • Platform Identification • Impossible Date (valid & not before 1997) • Impossible Location (-180 to 180, -90 to 90) • Position on Land (ETOPO5) • Impossible Speed (<=3m/s) • Global Range (-2.5 to 40C, 0 to 41 psu) • Regional Range (Red Sea, Mediterranean Sea) • Pressure Increasing • Spike (| V2 - (V3 + V1)/2 | - | (V3 - V1) / 2 ) Documents are at http://www.ifremer.fr/coriolis/cdc/argo_rfc.htm
Regional Range tests, definitions Red Sea · Temperature in range 21.7 to 40.0oC · Salinity in range 0.0 to 41.0 Mediterranean Sea · Temperature in range 10.0 to 40oC · Salinity in range 0.0 to 40.0
temperature salinity Multiple-value spikes can be a problem. temperature level Spike test examples
Automatic quality control • Top and Bottom Spike (no top spike test, bottom spike test currently under development) • Gradient (| V2 - (V3 + V1)/2 |) • Digit Rollover test (part of decoders) • Stuck Value (e.g. all values of T the same) • Density Inversion (gradient must be >=0) • Grey List (decided by PI & Operator) • Gross Salinity or Temperature Sensor Drift Test (checks if values in the deep ocean change too much, dT >1oC, dS >0.5 psu) Documents are at http://www.ifremer.fr/coriolis/cdc/argo_rfc.htm
Bottom spike examples Currently no test is available to detect this problem.
Gradient test examples If spikes are not excluded prior to application, then the test may flag some good points as bad. salinity level salinity level
Density inversion test examples Current version: top to bottom. Flags wrong point because of three bad values around a good one.
Density inversion test examples New version: top to bottom and bottom to top. One flag at wrong point because of three bad values around a good one.
Automatic quality control • Visual QC: at AOML currently triggered by failure of any of the other tests on the profile data (except for grey list test). Additionally triggered by climatology/reanalysis test. • Frozen profile (>=5 almost identical consecutive profiles). • Deepest pressure test: pressure may not exceed nominal profile pressure given in the meta file by more than 10%. Documents are at http://www.ifremer.fr/coriolis/cdc/argo_rfc.htm
Visual quality control Two cases of bad profiles that can not be detected by the standard Argo QC tests. For these a climatology test that triggers a visual QC can be very helpful. temperature level salinity level
pressure pressure Profile number Results of frozen profile test Blue circles indicate that T (top) or S (bottom) failed the test.
US Argo DAC web page at AOML http://www.aoml.noaa.gov/phod/ARGO/HomePage