Download
1 / 23
230 likes | 356 Vues
Spectral Study of CAL87. Ken Ebisawa (JAXA/ISAS) Dai Takei ( Rikkyo University) Thomas Rauch (University of Tuebinen ). CAL87. A super-soft source in LMC discovered by Einstein (“Columbia Astrophysics Laboratory” 87) Optical and X-ray eclipses with an orbital period of 10.6 hour

E N D
Spectral Study of CAL87 Ken Ebisawa (JAXA/ISAS) Dai Takei (Rikkyo University) Thomas Rauch (University of Tuebinen) Spectral Study of CAL87
CAL87 • A super-soft source in LMC discovered by Einstein (“Columbia Astrophysics Laboratory” 87) • Optical and X-ray eclipses with an orbital period of 10.6 hour • Relatively “hard” spectrum with significant emission above > 0.5 keV Spectral Study of CAL87
Optical light curve Continuous monitoring four 4 years B-band Secondary dip At f=0.5 Primary dip at f=0 R-band Indicates an accretion disk bulge with a bright irradiated disk (details later) Alcock et al. (1997) by product of MACHO project Spectral Study of CAL87
X-ray light curve with ROSAT • X-ray dips are shallower and broader compared to optical dips • No significant X-ray spectral variation • Accretion Disk Corona (ADC) model suggested • X-ray emitting corona is extended and only partially eclipsed (details later) X-ray light curve Optical light curve X-ray spectral hardness Schmidtke et al. (1993) Spectral Study of CAL87
Precise modeling the optical light curve • White dwarf with 0.75 M , secondary star with 1.5M • Examined several cases to fit optical light curves • Accretion disk has an optically thick “spray” • Optical emission region is not localized, but distributed over the secondary star • The white dwarf is never directly observed due to the presence of spray Spray Spray Optical emission Optical emission Schandl et al. (1997) Spectral Study of CAL87
Precise modeling the optical light curve disk and spray secondary star • Optically thick accretion disk and “spray” produce most of the optical emission • At the primary minimum, secondary occults most of the emission from the disk and the spray • Secondary star has minor optical emission • At the secondary minimum, the spray partially occults the secondary star • White dwarf surface is always hidden from the line of sight Spectral Study of CAL87 Schandl et al. (1997)
ASCA CCD observation • Strong absorption edge at 0.85 keV detected • Blend of strong OVIII edge (0.871 keV) and weak OVII edge(0.739 keV) • Optically thick atmospheric spectrum (Heise, van Teeseling and Kahabka 1994) suggested Fit including edge Residual without edge Residual including edge Asai et al. (1998) Spectral Study of CAL87
ASCA with white-dwarf atmosphere LTE model LTE model fit Best-fit LTE model Only kT is free parameter Surface gravity not constrained kT=75 eV (log g=9) kT=89 eV (log g=10) Model by Heise, van Teeseling and Kahabka (1994) Ebisawa et al. (2001) Spectral Study of CAL87
ASCA with white-dwarf atmosphere NLTE model NLTE model fit Best-fit NLTE model Only kT is free parameter Surface gravity not constrained kT=65eV (log g=9) kT=79 eV (log g=10) Model by Hartmann et al. (1999) (not including absorption lines) Ebisawa et al. (2001) Spectral Study of CAL87
Interpretation of the ASCA spectrum Solution Luminosity is calculated from the radius (mass) and Teff • WD mass is from 0.8 to 1.2 M • Intrinsic luminosity is from 0.4-1.2x1038erg/s • However, the observed luminosity is about an order of magnitude lower • We are observing the scattered emission with tsct~0.1 • Consistent with the ADC model and the optical light curve result (WD is always hidden) For a given mass (gravity), Teff is constrained from the model fit allowed range (considering model uncertainty) WD mass, radius and surface gravity have almost unique relationship Spectral Study of CAL87 Ebisawa et al. (2001)
Modeling the ASCA light curve WD is permanently blocked X-ray emission from extended ADC Spectral Study of CAL87 Ebisawa et al. (2001)
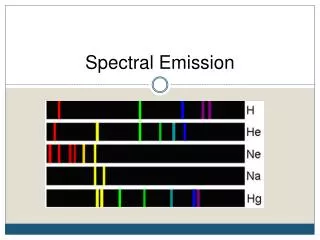
XMM and Chandra grating observations Numerous emission lines!! Spectral Study of CAL87
XMM and Chandra grating observations LETG spectrum explained with optically thin emission (photoionized plasma) Greiner et al. (2004) Spectral Study of CAL87
No optically thick component? • “Discovery” of numerous emission lines • Not noticeable with CCD spectral resolution • Emission lines are expected from photoionized accretion disk corona • Gratings are insensitive above ~0.9 keV • Not sensitive to weak continuum emission • Difficult to recognize the OVIII edge at 0.871 keV • Optically thick component exists, as well as the optically thin component Spectral Study of CAL87
XMM, Chandra, ASCA simultaneous fit • Eight spectra fitted simultaneously • XMM RGS1, RGS2, EPIC, MOS1, MOS2 • Chandra LETG • ASCA SIS0, SIS1 • Includes both optically thick and thin components Spectral Study of CAL87
Blackbody+two edges +emission lines linear scale Spectral Study of CAL87
Blackbody+two edges +emission lines log scale EPIC MOS RGS LETG ASCA Spectral Study of CAL87
Best-fit model: Blackbody+two edges +emission lines linear scale Spectral Study of CAL87
Best-fit model: Blackbody+two edges +emission lines log scale Spectral Study of CAL87
Application of the state of the art WD NLTE model Rauch 2009 private communication 800,000 K OVIII log g=9 LMC abundance OVIII 1,000,000 K 900,000 K Spectral Study of CAL87
Rauch NLTE model + emission lines T=800,000 K Need improvement, But manageable Spectral Study of CAL87
The best-fit model (NLTE + emission lines) Absorption edges, absorption lines and emission lines Spectral Study of CAL87
Conclusion • We presented spectral model of CAL87 observed with XMM-Newton and Chandra, following the provisional study using ASCA. • We confirmed both the WD surface emission (with absorption edges and lines) and the Accretion Disk Corona emission (emission lines). • Presence of both optically thick and thin spectral components makes the SSS study formidable, but we are establishing a plausible model. Spectral Study of CAL87