State Diffusion Lab home version
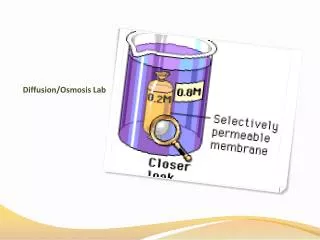
State Diffusion Lab home version. The page numbers in this presentation refer to the New York State Diffusion Through a Membrane Lab Handout. Slide 2. Refer to page 2. The initial set up. The “Cell” filled with glucose and starch solutions. Water & Iodine in the beaker covers the “cell”.

State Diffusion Lab home version
E N D
Presentation Transcript
State Diffusion Labhome version The page numbers in this presentation refer to the New York State Diffusion Through a Membrane Lab Handout
Slide 2 Refer to page 2 The initial set up The “Cell” filled with glucose and starch solutions Water & Iodine in the beaker covers the “cell”
Slide 3 #9 on page 2 Predict what you think will diffuse in this set up. Remember: There’s starch and glucose inside the “cell” and iodine outside the cell. Be sure to write where you believe the substances will move (into or out of the cell).
Slide 4 Refer to page 3 Chemical Test Results: Blue-colored Glucose Indicator Solution Please remember that you must heat the test tubes containing Benedict’s Solution for this color change to occur! *If it turns orange/red when heated, glucose is present. On your data table, write the color of each solution in the appropriate space.
Slide 5 Page 3 continued Chemical Test Results Amber-colored Starch Indicator Solution: On your data table, record the colors in the appropriate spaces on the data table.
Refer to page 4 Slide 6 Changes to the original lab set up from slide 2. On your lab at the 2nd bullet point, record the changes you see. Go to the next slide if you do not remember how it looked in the initial stage.
What has changed? Slide 7 FINAL STAGE INITIAL STAGE There is one visible difference between the two…write about this difference, at the 2nd bullet point on page 4 of your lab.
Slide 8 Page 4- 3rd bullet point Results of the glucose test on the water from the beaker in the final state of the set up in Part 1 of the lab. Refer back to slide 4 if you need a reminder about what this color change means (positive for glucose or negative for glucose). Beaker solution with Benedict’s after heating Beaker solution with Benedict’s before heating
Slide 9 Page 4 Initial and Final State I S G Use the letters I, S, and G to represent the substances used. I’ve done the Initial State for you. Refer back to the chemical test results (slides 7 & 8) and the set up images to complete the Final State diagram
Slide 10 Pages 4 & 5 Answer questions #1-6. Questions #1-3 use the information on pages 3 & 4 of the lab to answer. Question #6 can be answered using the information found on the front of the lab. For question #7 on page 5, you will re-draw exactly what you did back on page 4.
Slide 11 Part 2- Osmosis Please read the information on pages 5 & 6, then continue on page 7 (next slide)
Page 7 onion cell Typical red onion cells mounted in water: Look at the pink part (the cytoplasm surrounded by a cell membrane)
Page 7- onion cell continued First answer #8 on page 7. Then draw an onion cell in salt water at the bottom of the page. Look at the cytoplasm, now. It is darker and smaller…the cell wall is the same size.
Page 8 Answer question #11. Examine the image at right (onion cell in Fresh water). Describe the appearance of the cells at right for question #13 Draw a diagram of an onion cell in Fresh water. It will look like your original drawing on page 7.
Answer the Analysis QuestionsIt will help you to draw a diagram for each question. Here’s an example of what you might draw…The End Water will diffuse out 98% water 95% water