Geoscience Education and Diversity
Geoscience Education and Diversity. Dr. Jacqueline E. Huntoon, Program Director for Diversity and Education, Geosciences Directorate, National Science Foundation. To keep the geoscience workforce strong, increases are needed in the…. numbers of graduates from post-baccalaureate programs,

Geoscience Education and Diversity
E N D
Presentation Transcript
Geoscience Education and Diversity Dr. Jacqueline E. Huntoon, Program Director for Diversity and Education, Geosciences Directorate, National Science Foundation
To keep the geoscience workforce strong, increases are needed in the… • numbers of graduates from post-baccalaureate programs, • numbers of graduates from 2-year and 4-year degree programs, • numbers enrolled in college-level courses, and • interest in geoscience among pre-college students.
To keep the geoscience workforce responsive to society, increases are needed in the… • visibility of geoscience and geoscientists, • awareness of geoscience-related issues (particularly in communities with diverse populations), and • diversity of geoscientists.
Source: U.S. Census Bureau, 2004, "U.S. Interim Projections by Age, Sex, Race, and Hispanic Origin," http://www.census.gov/ipc/www/usinterimproj/.
Source: U.S. Census Bureau, 2004, "U.S. Interim Projections by Age, Sex, Race, and Hispanic Origin," http://www.census.gov/ipc/www/usinterimproj/.
Data from: NSF/SRS, Science and Engineering Degrees: 1966-2000, NSF 02-327, Author, Susan T. Hill (Arlington, VA). Table 5. Tabulated by NSF/SRS; data from Dept. of Ed. Nat’l Center for Ed. Statistics: Integrated Postsecondary Education Data System Completions Survey.
Data from: NSF/SRS, Science and Engineering Degrees: 1966-2000, NSF 02-327, Author, Susan T. Hill (Arlington, VA). Table 12. Tabulated by NSF/SRS; data from Dept. of Ed. Nat’l Center for Ed. Statistics: Integrated Postsecondary Education Data System Completions Survey.
Data from: NSF/SRS, Science and Engineering Degrees: 1966-2000, NSF 02-327, Author, Susan T. Hill (Arlington, VA). Table 19. Tabulated by NSF/SRS; data from NSF/SRS: Survey of Earned Doctorates (Research Doctorates).
Note: In this figure, minority includes Black, American Indian or Alaskan Native, and Hispanic, but does not include Asian or Pacific Islander, Unknown and Other, White Non-Hispanic, or Temporary Resident. Compiled from http://caspar.nsf.gov - webCASPAR database. Data from the Higher Education General Information Survey (HEGIS) and NCES/IPEDS.
Note: In this figure, minority includes Black, American Indian or Alaskan Native, and Hispanic, but does not include Asian or Pacific Islander, Unknown and Other, White Non-Hispanic, or Temporary Resident. Compiled from http://caspar.nsf.gov - webCASPAR database. Data from the Higher Education General Information Survey (HEGIS) and NCES/IPEDS.
Note: In this figure, minority includes Black, American Indian or Alaskan Native, and Hispanic, but does not include Asian or Pacific Islander, Unknown and Other, White Non-Hispanic, or Temporary Resident. Compiled from http://caspar.nsf.gov - webCASPAR database. Data from the Higher Education General Information Survey (HEGIS) and NCES/IPEDS.
Note: In this figure, minority includes Black, American Indian or Alaskan Native, and Hispanic, but does not include Asian or Pacific Islander, Unknown and Other, White Non-Hispanic, or Temporary Resident. Compiled from http://caspar.nsf.gov - webCASPAR database. Data from the Higher Education General Information Survey (HEGIS) and NCES/IPEDS.
Note: In this figure, minority includes Black, American Indian or Alaskan Native, and Hispanic, but does not include Asian or Pacific Islander, Unknown and Other, White Non-Hispanic, or Temporary Resident. Compiled from http://caspar.nsf.gov - webCASPAR database. Data from the Higher Education General Information Survey (HEGIS) and NCES/IPEDS.
Note: In this figure, minority includes Black, American Indian or Alaskan Native, and Hispanic, but does not include Asian or Pacific Islander, Unknown and Other, White Non-Hispanic, or Temporary Resident. Compiled from http://caspar.nsf.gov - webCASPAR database. Data from the Higher Education General Information Survey (HEGIS) and NCES/IPEDS.
Data from NSF webCASPAR database (http://caspar.nsf.gov), derived from IPEDS data. Identical to data presented in Science and Engineering Degrees 1966-2000, NSF –2-327, Susan T. Hill.
Data from NSF webCASPAR database (http://caspar.nsf.gov), derived from IPEDS data. Identical to data presented in Science and Engineering Degrees 1966-2000, NSF –2-327, Susan T. Hill.
Data from: NSF/SRS, Science and Engineering Degrees: 1966-2000, NSF 02-327, Author, Susan T. Hill (Arlington, VA). Tables 21 and 23. Tabulated by NSF/SRS; data from NSF/SRS: Survey of Earned Doctorates (Research Doctorates).
Data tabulated by National Science Foundation/Division of Science Resources Statistics; data from Department of Education/National Center for Education Statistics: Integrated Postsecondary Education Data System Completions Survey, Table 40. B.S. degrees from NCES/IPEDS.
Data tabulated by National Science Foundation/Division of Science Resources Statistics; data from Department of Education/National Center for Education Statistics: Integrated Postsecondary Education Data System Completions Survey, Table 40. M.S. degrees from NCES/IPEDS.
Data tabulated by National Science Foundation/Division of Science Resources Statistics; data from Department of Education/National Center for Education Statistics: Integrated Postsecondary Education Data System Completions Survey, Table 40. Ph.D. degrees from NSF/SRS Survey of Earned Doctorates.
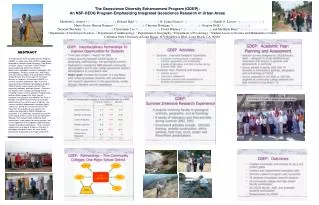
Effective Strategies • Show relevance – applications related to modern, technologically savvy, increasingly urban and industrialized world. • Build partnerships between universities, community colleges, K-12 teachers and guidance counselors, families, and communities to address pipeline issues. • Promote mentoring relationships among scientists, educators, and students.
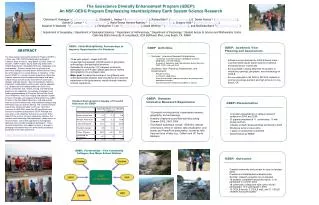
Effect of NSF Undergraduate Research Programs Source: SRI International URO survey, 2003.
Effective Strategies • Provide financial support to facilitate participation in the geosciences among all members of the diverse U.S. population. • Publicize traditional and non-traditional geoscience career opportunities.
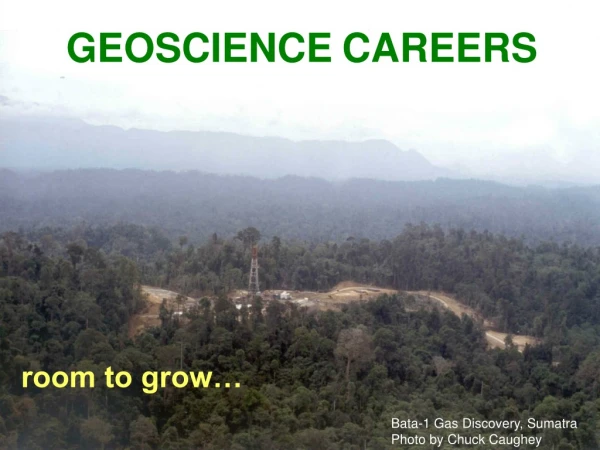
Geoscience Careers • Geoscientists • Work at remote field sites is common. • Federal, State, and local governments employ nearly one-half of all geoscientists. • A bachelor’s degree is adequate for a few entry-level jobs, but a master’s degree is usually the minimum educational requirement; a Ph.D. degree is required for most high-level research positions. • Employment of geoscientists and atmospheric scientists is expected to grow as fast as average (increase 10-20% from 2002-2012), while environmental scientists and hydrologists will experience faster than average growth (21-35%). From National Bureau of Labor Statistics, data do not include college and university faculty. The geoscience category includes geoscientists, hydrologists, and environmental scientists. The geoscience category does not include atmospheric scientists.
Geoscience Careers • Employment trends: • 30 % in architectural, engineering, and related services • 15 % in oil and gas extraction companies. • 3,000 in federal government (USDOI, USGS, DOD) • 3,400 in state governmental agencies • 3 % self-employed, as consultants to industry or government From National Bureau of Labor Statistics, the geoscience category as used here does not include atmospheric scientists, environmental scientists, hydrologists, or college and university faculty. Data for 2002.
Geoscience Careers • Environmental scientists, geoscientists, hydrologists, and atmospheric scientists held about 108,700 jobs in 2002. • Environmental scientists = 65,000 • Geoscientists = 28,000 • Hydrologists = 8,000 • Atmospheric Scientists = 7,700 From National Bureau of Labor Statistics.
Geoscience Careers • Median for Geoscientists = $67,470 • Starting Salaries: • Bachelor’s Degree = $32,828 • Master’s Degree = $47,981 • Doctorate Degree = $61,050 National Bureau of Labor Statistics Data for 2002. Values shown here are for geoscientists as classified by the National Bureau of Labor Statistics and do not include environmental scientists, hydrologists, atmospheric scientists, or college and university faculty.
Conclusions • Women and minorities who enter the geosciences tend to stay in the field at a higher rate than do students in other sciences (except Psychology and Social Sciences). • High-paying career opportunities in the geosciences exist, but need to be better publicized.