Download
1 / 11
110 likes | 230 Vues
This resource covers essential concepts in stellar astronomy, focusing on the apparent magnitudes of stars, such as Star A with a magnitude of 0.4 and Star B at 1.2, which determines their relative brightness. Students will explore how stars are plotted on the Hertzsprung-Russell (H-R) diagram, classify stars according to spectral classes from O to M based on temperature, and understand the characteristics of main sequence stars, giants, supergiants, and white dwarfs. Important dates for Exam 2 and key announcements are included.

E N D
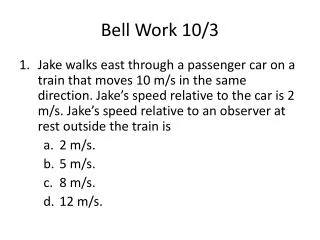
Bell: 10/3 • Star A has an apparent magnitude of 0.4 and Star B has an apparent magnitude of 1.2. Which star appears brighter? Which star appear larger? • Objectives: • Understand how stars are plotted on an H-R diagram. • Be able to classify stars according to spectral class.
Announcements • Exam 2: Monday – 10/6 • End of quarter: 10/10
H-R Lab Brightest Absolute Magnitude Dimmest Highest Lowest Temperature in K
Hertzsprung-Russell Diagram • Developed by astronomers EjnarHertzsprung and Henry Russell
Size comparison of Stars https://www.youtube.com/watch?v=HEheh1BH34Q
Spectral Classes • Stars are categorized based on their temperature. • The hottest stars are Class O. • The Coldest stars are Class M. 7,240 K 12,570℉ 41,000 K 73,340 ℉ 3850 K 6,470 ℉