Download
1 / 108
1.09k likes | 1.27k Vues
ELECTROPHYSIOLOGY. Single Neuron Recording Patch Clamp Recording ECG EEG- Brain activity Recording PET, MRI, fMRI ,CAT. Single-unit recording. It is the use of an electrode to record the electrophysiological activity (action potentials) from a single neuron.

E N D
ELECTROPHYSIOLOGY Single Neuron Recording Patch Clamp Recording ECG EEG- Brain activity Recording PET, MRI, fMRI ,CAT
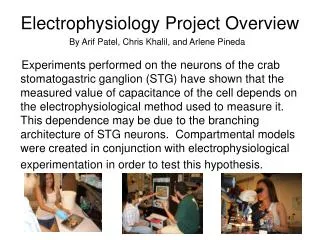
Single-unit recording • It is the use of an electrode to record the electrophysiological activity (action potentials) from a single neuron.
An electrode introduced into the brain of a living animal will detect electrical activity that is generated by the neurons adjacent to the electrode tip. If the electrode is a microelectrode, with a tip size of 3 to 10 micrometers, the electrode will often isolate the activity of a single neuron.
The activity consists of the voltages generated in the extra cellular matrix by the current fields outside the cell when it generates an action potential. Recording in this way is generally called "single-unit" recording.
The recorded action potentials look very much like the action potentials that are recorded intracellularly, but the signals are very much smaller (typically about 0.1 mV).
Recordings of single neurons in living animals have provided important insights into how the brain processes information, following the hypothesis put forth by Edgar Adrian that unitary action potential events are the fundamental means of communication in the brain.
Microelectrodes used for extra cellular single-unit recordings are usually very fine wires made from tungsten or platinum-iridium alloys that are insulated except at their extreme tip and are less often glass micropipettes filled with a weak electrolyte solution similar in composition to extra cellular fluid.
Hubel and Wieselwere awarded the Nobel Prize in Physiology or Medicine in 1981.
The patch clamp technique • It is a laboratory technique in electrophysiology that allows the study of single or multiple ionchannels in cells.
The technique can be applied to a wide variety of cells, but is especially useful in the study of excitable cells such as neurons, cardiomyocytes, muscle fibers and pancreatic beta cells. It can also be applied to the study of bacterial ion channels in specially prepared giant spheroplasts.
It is a laboratory technique in electrophysiology that allows the study of single or multiple ionchannels in cells
Erwin Neher and Bert Sakmann developed the patch clamp in the late 1970s and early 1980s. • This discovery made it possible to record the currents of single ion channels for the first time, proving their involvement in fundamental cell processes such as action potential conduction.
Neher and Sakmann received the Nobel Prize in Physiology or Medicine in 1991 for this work.
Patch clamp recording uses, as an electrode, a glass micropipette that has an open tip diameter of about one micrometer, a size enclosing a membrane surface area or "patch" that often contains just one or a few ion channel molecules
In some experiments, the micropipette tip is heated in a microforge to produce a smooth surface that assists in forming a high resistance seal with the cell membrane. • The interior of the pipette is filled with a solution matching the ionic composition of the bath solution, as in the case of cell-attached recording, or the cytoplasm for whole-cell recording
Unlike traditional two-electrode voltage clamp recordings, patch clamp recording uses a singleelectrode to record currents.
As cardiac impulses pass through the heart, electrical currents spread into the tissues surrounding the heart, and a small portion of these currents spread throughout the surface of the body.
If electrodes are placed on the skin on opposite sides of the heart, electrical potential generated by these currents can be recorded.
Electrocardiograph is an instrument which records the electrical activity of the heart during a cardiac cycle.
A record of the minute electrical pulses generated by the heart used to determine the condition of the patient’s heart is the ElectroCardioGram.
Electrodes are placed on the chest and limbs, and the impulses which they detect are amplified by the electrograph to which the electrodes are connected.
The ECG was developed by William Einthoven of Leiden University, England between 1903 and 1910
Electrical impulses in the heart originate in the sinoatrial node and travel through the heart muscle where they impart electrical initiation of systole or contraction of the heart. • The electrical waves can be measured at selectively placed electrodes (electrical contacts) on the skin.
Electrodes on different sides of the heart measure the activity of different parts of the heart muscle. • An ECG displays the voltage between pairs of these electrodes, and the muscle activity that they measure, from different directions, also understood as vectors.
This display indicates the overall rhythm of the heart and weaknesses in different parts of the heart muscle. • It is the best way to measure and diagnose abnormal rhythms of the heart, particularly abnormal rhythms caused by damage to the conductive tissue that carries electrical signals, or abnormal rhythms caused by levels of dissolved salts (electrolytes), such as potassium, that are too high or low. In myocardial infarction (MI), the ECG can identify damaged heart muscle
The ECG cannot reliably measure the pumping ability of the heart; for which ultrasound-based (echocardiography) or nuclear medicine tests are used.
A typical electrocardiograph runs at a paper speed of 25 mm/s, although faster paper speeds are occasionally used. Each small block of ECG paper is 1 mm². • At a paper speed of 25 mm/s, one small block of ECG paper translates into 0.04 s (or 40 ms). • Five small blocks make up 1 large block, which translates into 0.20 s (or 200 ms). • Hence, there are 5 large blocks per second.
A standard signal of 1 mV must move the stylus vertically 1 cm, that is two large squares on ECG paper.
Leads used in ECG • Limb Leads • Leads I, II and III are the so-called limb leads • Lead I is a dipole with the negative (white) electrode on the right arm and the positive (black) electrode on the left arm. • Lead II is a dipole with the negative (white) electrode on the right arm and the positive (red) electrode on the left leg. • Lead III is a dipole with the negative (black) electrode on the left arm and the positive (red) electrode on the left leg.
Augmented limb • Leads aVR, aVL, and aVF are 'augmented limb leads'. They are derived from the same three electrodes as leads I, II, and III. However, they view the heart from different angles • Lead aVR or "augmented vector right" has the positive electrode (white) on the right arm. The negative electrode is a combination of the left arm (black) electrode and the left leg (red) electrode, which "augments" the signal strength of the positive electrode on the right arm.
Lead aVL or "augmented vector left" has the positive (black) electrode on the left arm. The negative electrode is a combination of the right arm (white) electrode and the left leg (red) electrode, which "augments" the signal strength of the positive electrode on the left arm. • Lead aVF or "augmented vector foot" has the positive (red) electrode on the left leg. The negative electrode is a combination of the right arm (white) electrode and the left arm (black) electrode, which "augments" the signal of the positive electrode on the left leg
Precordial • The precordial leads V1, V2, V3, V4, V5, and V6 are placed directly on the chest. Because of their close proximity to the heart, they do not require augmentation
Waves and intervals • A typical ECG tracing of a normal heartbeat (or cardiac cycle) consists of a P wave, a QRS complex and a T wave. • A small U wave is normally visible in 50 to 75% of ECGs. The baseline voltage of the electrocardiogram is known as the isoelectric line. • Typically the isoelectric line is measured as the portion of the tracing following the T wave and preceding the next P wave.
P wave • During normal atrial depolarization, the main electrical vector is directed from the SA node towards the AV node, and spreads from the right atrium to the left atrium. • This turns into the P wave on the ECG, which is upright in II, III, and aVF and inverted in aVR . A P wave must be upright in leads II and aVF and inverted in lead aVR to designate a cardiac rhythm as Sinus Rhythm.
The relationship between P waves and QRS complexes helps distinguish various cardiac arrhythmias. • The shape and duration of the P waves may indicate atrial enlargement
QRS complex • The QRS complex is a structure on the ECG that corresponds to the depolarization of the ventricles. • Because the ventricles contain more muscle mass than the atria, the QRS complex is larger than the P wave.
In addition, because the His/Purkinje system coordinates the depolarization of the ventricles, the QRS complex tends to look "spiked" rather than rounded due to the increase in conduction velocity. • A normal QRS complex is 0.08 to 0.12 sec (80 to 120 ms) in duration represented by three small squares or less, but any abnormality of conduction takes longer, and causes widened QRS complexes
PR/PQ interval • The PR interval is measured from the beginning of the P wave to the beginning of the QRS complex. • It is usually 120 to 200 ms long. On an ECG tracing, this corresponds to 3 to 5 small boxes. In case a Q wave was measured with a ECG the PR interval is also commonly named PQ interval instead. • A PR interval of over 200 ms may indicate a first degree heart block.
A short PR interval may indicate a pre-excitation syndrome via an accessory pathway that leads to early activation of the ventricles, such as seen in Wolff-Parkinson-White syndrome. • A variable PR interval may indicate other types of heart block.
The duration, amplitude, and morphology of the QRS complex is useful in diagnosing cardiac arrhythmias, conduction abnormalities, ventricular hypertrophy, myocardial infarction, electrolyte derangements, and other disease states.
"Buried" inside the QRS wave is the atrial repolarization wave, which resembles an inverse P wave. • It is far smaller in magnitude than the QRS and is therefore obscured by it.
ST segment • The ST segment connects the QRS complex and the T wave and has a duration of 0.08 to 0.12 sec (80 to 120 ms). • It starts at the J point (junction between the QRS complex and ST segment) and ends at the beginning of the T wave.
The typical ST segment duration is usually around 0.08 sec (80 ms). • The normal ST segment has a slight upward concavity.
T wave • The T wave represents the repolarization (or recovery) of the ventricles. • The interval from the beginning of the QRS complex to the apex of the T wave is referred to as the absolute refractory period.
The last half of the T wave is referred to as the relative refractory period (or vulnerable period). Tall or "tented" symmetrical T waves may indicate hyperkalemia. • Flat T waves may indicate coronary ischemia or hypokalemia.
QT interval • The QT interval is measured from the beginning of the QRS complex to the end of the T wave. • Normal values for the QT interval are between 0.30 and 0.44 seconds.
The QT interval as well as the corrected QT interval are important in the diagnosis of long QT syndrome and short QT syndrome. • The QT interval varies based on the heart rate, and various correction factors have been developed to correct the QT interval for the heart rate.