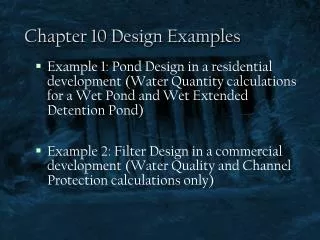
Chapter 10 Design Examples
Chapter 10 Design Examples. Example 1: Pond Design in a residential development (Water Quantity calculations for a Wet Pond and Wet Extended Detention Pond) Example 2: Filter Design in a commercial development (Water Quality and Channel Protection calculations only). Example 1:

Chapter 10 Design Examples
E N D
Presentation Transcript
Chapter 10 Design Examples Example 1: Pond Design in a residential development (Water Quantity calculations for a Wet Pond and Wet Extended Detention Pond) Example 2: Filter Design in a commercial development (Water Quality and Channel Protection calculations only)
Example 1: Pond Design in a residential development
Example 1 Stone Hills Estate is a 45-acre residential development with 20 acres of off-site drainage, which is currently in a meadow condition.
Example 1A Step 1. Establish Hydrologic Input Parameters and Develop Site Hydrology • Hydrology Sizing Method Example: • Using the Type III Rainfall Map and the inputs in Table 10.5.1, the results of the hydrologic analysis were computed and are shown in Table 10.5.2.
Example 1A (cont.) WQv = Estimated runoff volume (acre-feet) resulting from the 1-year, 24 hour design storm over the post development watershed (includes contributing on-site and off-site drainage from impervious and pervious areas alike) The results of the hydrologic calculations show that the 1-year, 24-hour event results in 0.99 inches of runoff over the total contributing site area. Therefore, the WQv can be calculated as follows: Step 2. Compute Water Quality Volume, (WQv) = (Total Drainage Area) (V1-yr) = (65.1 ac) (0.99 in) (1 ft/12 in) = 5.37 ac-ft
Example 1A (cont.) In final stabilization of the site, soil-decomposition practices are applied to all disturbed areas. Because of soil restoration practice, hydrologic soil group curve numbers applied to the grass areas are kept as those of pre-construction condition. Step 2. Compute Water Quality Volume, (WQv) (cont.)
Example 1A (cont.) The conventional design WQv of 5.37 ac-ft results from a site design that includes 45 acres of disturbed area. A detention pond would need to be designed to treat the WQv on-site. The area required for this practice has a footprint of around 0.7 acres from treatment of runoff from 108 houses and roads. To reduce the flow by source control, two Better Site Design (BSD) features are selected to be incorporated in the site plan: 1) vegetated buffers and 2) raingardens. Step 3. Evaluate Source Control and Compute Flow Reduction
Example 1A (cont.) Vegetated Buffers: Preserve 4 acres of undisturbed natural area as forested area rather than converting the areas to lawn area Applied to C and D soil types to reduce the CN from 78 to 77 Raingardens (RGs): RGs designed to collect runoff from a section of the rooftop on half of the lots (56 rooftops) as well as runoff from driveways and lawns. Routing flow through the RGs results in reduction of WQv based upon the storage size of the RG A RGs maximum allowable contributing impervious area is 1000 ft2, designed to store and filter stormwater within the planting media and to exfiltrate a fraction of the 1-yr storm to the ground This practice was applied to lots with C soils An average of 270 ft2 surface area was used for the RG which were located within 30 ft of downspouts. A bypass also routes excess flow to the pond when RG capacity is exceeded Step 3. Evaluate Source Control and Compute Flow Reduction (cont.)
Example 1A (cont.) Storage capacity of the RGs is calculated based on the following parameters in Table 10.5.5. Step 3. Evaluate Source Control and Compute Flow Reduction (cont.)
Question 1 • How much larger would RGs need to be to achieve 10% reduction? 25%? 450 90 90 405 22,680 • Answer 10%, 0.52 ac/ft - 21’x21’ – 25%, 1.3 ac/ft, 33’x33’
Question 2 • What other approaches could have reduced runoff volumes at the planning level? Name three.
Example 1A (cont.) Therefore, adding 56 RGs controls runoff from approximately 1.3 acres of rooftop and 1.3 acres of lawns, which results in control and reduction of: = 13,608 ft3 = 0.31 ac-ft of WQv OR 6% reduction in WQv Note: 0.31 ac-ft infiltrates into the native soil and does not reach the height of the rectangular weir outlet structure (1.5 ft) designed to safely drain the overflow from the RG into the conveyance system. Step 3. Evaluate Source Control and Compute Flow Reduction (cont.)
Example 1A (cont.) The channel protection volume (Cpv) requirement is achieved by detaining the 1-year, 24-hour storm to achieve a center of mass detention time (CMDT) of at least 24 hours. This can be achieved by adjusting the outlet structure of the pond. In some cases, this will require reducing the extended detention orifice size and adjusting the overflow weir design. By modifying the pond volume and the elevation and size of the outlet structure(s), in a trial and error fashion, the Cpv requirement can be met. Step 4. Compute Stream Channel Protection Volume, (Cpv)
Example 1A (cont.) Wet ponds are not designed for detaining flow; therefore, the difference between the inflow and outflow hydrographs is insignificant when sized purely for water quality control. The Cpv requirement may be provided above the WQv in a wet pond or a stormwater wetland. Therefore, once a pond has been sized to meet the WQv requirement, a TR-55 and TR-20 (or approved equivalent) model may be used to determine CMDT. Step 4. Compute Stream Channel Protection Volume, (Cpv) (cont.)
Outlet riser Overbank Protection volume (Qp-10) Overbank Protection outlet Channel Protection volume (Cpv) Extended Detention Channel Protection outlet Extended Detention outlet Water quality volume (WQv) Permanent Pool Outlet barrel Wet Extended Detention Pond • WQv divided btw. Permanent Pool and Extended Detention volume • Wet Pond • WQv = 100% Permanent Pool • No Extended Detention outlet
Example 1A (cont.) Step 4. Compute Stream Channel Protection Volume, (Cpv) (cont.) • Alternatively, the methodologies in Appendix B of the Design Manual can be followed to ensure the Cpv requirement is met. An example of this methodology is shown in Section 8.1 of Chapter 8. • Additionally, it may be necessary to install detention ponds or underground vaults onsite to meet the Cpv requirement of 24-hour extended detention if pond sizes become too large. • Note that although these practices meet water quantity goals, they are unacceptable for water quality control because of poor pollutant removal and need to be installed subsequent to a water quality practice (Section 10.2 of the Design Manual) to ensure enhanced phosphorus removal.
Example 1A (cont.) Step 5. Additional Sizing Requirements • Standard procedures for computing the Overbank Flood Protection Volume (Qp10), the Extreme Flood Protection Volume (Qf), and the Safe Passage of 100-Year Design Storm (Qf) remain the same. Procedures are outlined in Chapter 8 of the Design Manual.
Example 1B • Pond Design Example: Calculations for both a Wet Pond and an Extended Detention Wet Pond are provided. Step 1. Compute Preliminary Runoff Control Volumes • The WQv requirements were developed in Part A of this example
Example 1B Step 2. Determine whether the development site and conditions are appropriate for the use of a stormwater pond • There are no additional requirements for this site. Procedures are identical to those presented in Chapter 8 of the Design Manual. • There are no additional requirements for this site. Procedures are identical to those presented in Chapter 8 of the Design Manual. • Size wet forebay to treat 10% of the WQv = (10%) (5.1 ac-ft) = 0.51 ac-ft Note: Forebay volume is included in the WQv as part of the permanent pool volume Step 3. Confirm local design criteria and applicability Step 4. Determine pre-treatment volume
Example 1B Step 5. Determine permanent pool volume and extended detention (ED) volume • Size the permanent pool volume to contain 50% of the WQv: = (0.5) (5.10 ac-ft) = 2.55 ac-ft (includes 0.51 ac-ft forebay volume) • Size the ED volume to contain 50% of the WQv: = (0.5) (5.10 ac-ft) = 2.55 ac-ft
Example 1B Step 6. Determine pond location and preliminary geometry. Conduct pond grading and determine storage available for WQv permanent pool and WQv-ED (if applicable) • This step involves initially grading the pond (establishing contours) and determining the elevation-storage relationship for the pond. • Storage must be provided for the permanent pool (including sediment forebay), extended detention (WQv-ED) and the Cpv-ED. • Calculations for the 10-year, and 100-year storms, plus sufficient additional storage to pass the ultimate condition 100-year storm with required freeboard can be found in Chapter 8 of the Design Manual. • An elevation-storage table and curve was prepared using the average area method for computing volumes.
Example 1B Step 6. Determine pond location and preliminary geometry. Conduct pond grading and determine storage available for WQv permanent pool and WQv-ED (if applicable)
Example 1B Step 6. Determine pond location and preliminary geometry. Conduct pond grading and determine storage available for WQv permanent pool and WQv-ED (if applicable) (cont.) • Set basic elevations for pond structures: • Set the pond bottom at elevation 621.0 • Provide gravity flow to allow for pond drain set riser invert at 620.5 • Set barrel outlet elevation at 620.0 • Set water surface and other elevations • Required permanent pool volume = 50% of WQv = 2.55 ac-ft. From the elevation-storage table, read elevation 625.2 (2.83 ac-ft > 2.55 ac-ft) site can accommodate it and it allows a small safety factor for fine sediment accumulation - OK
Example 1B Step 6. Determine pond location and preliminary geometry. Conduct pond grading and determine storage available for WQv permanent pool and WQv-ED (if applicable) (cont.) • Set permanent pool WSEL = 625.2 • Forebay volume provided in single pool with volume = 0.51 ac-ft – OK • Add 1 ft to the depth of the forebay to account for sacrificial storage for sediment deposition. • The pond pretreatment bottom is set at elevation 620.0 • Required extended detention volume (WQv-ED) = 2.55 ac-ft. From the elevation-storage table (volume above permanent pool), read elevation 627.5 (2.78 ac-ft > 2.55 ac-ft) OK. Set ED wsel = 627.5 • Check the pond surface area to drainage area ratio: • NOTE: Total storage at elevation 627.5 = 5.61 ac-ft (greater than required WQv of 5.1 ac-ft)
Example 1B Step 6. Determine pond location and preliminary geometry. Conduct pond grading and determine storage available for WQv permanent pool and WQv-ED (if applicable) (cont.) • Compute the required WQv-ED orifice diameter to release 2.55 ac-ft during 24 hours (for Wet ED Pond Only) • Avg. ED release rate = (2.55 ac-ft)(43,560 ft2/ac)/(24 hr)(3600 sec/hr) = 1.29 cfs • Invert of orifice set at wsel = 625.2 • Average head = (627.5 - 625.2)/ 2 = 1.15' • Use orifice equation to compute cross-sectional area and diameter • Q = CA(2gh)0.5, for Q=1.29 cfs h = 1.15 ft; C = 0.6 = discharge coefficient • Solve for A • A = 1.29 cfs / [(0.6)((2)32.2 ft/s2)(1.15 ft))0.5] A = 0.25 ft2, A =πd2 / 4; • dia. = 0.57 ft = 6.76 inches • Use 8" pipe with a gate valve to achieve equivalent diameter.
Example 1B Step 6. Determine pond location and preliminary geometry. Conduct pond grading and determine storage available for WQv permanent pool and WQv-ED (if applicable) (cont.) • Compute the stage-discharge equation for the 6.9” dia. WQv-ED orifice. • QWQv-ED = CA(2gh)0.5 = (0.6) (0.2 ft2) [((2)(32.2 ft/s2))0.5] (h0.5) • QWQv-ED = (1.25) h0.5, where: h = wsel - 625.65 • Note: Account for one half of orifice diameter when calculating head.) NOTE: In Wet Pond design, there is no WQv-ED orifice. All of the 1-year, 24-hour volume is retained.
Example 1B Step 7. Set the Cpv pool elevation. Compute Cpv-ED orifice size, compute release rate for Cpv control and establish elevation. CPv Sizing for Wet Ponds: • To determine the required Cpv, a TR-55 model was developed to demonstrate increasing the elevation of the pond and the sizing of a Cpv outlet to achieve a center of mass detention time (CMDT) of at least 24 hours (24-hour extended detention of the 1-year, 24-hour storm event). • Based on the TR-55 output data: • Required Cpv storage to meet 24-hour CMDT = 3.09 ac-ft • Diameter of Cpv-ED orifice = 4.4 inches at an elevation of 627.5 (determined from TR-55 model) • Overflow Weir = 100’ wide earth spillway at 628.75 (not shown on the schematics) • Required CMDT = 25.2 hrs
Example 1B Step 7. Set the Cpv pool elevation. Compute Cpv-ED orifice size, compute release rate for Cpv control and establish elevation (cont.) CPv Sizing for Wet Extended Detention Pond: • The WQv for enhanced phosphorus removal is sized for the 1-year event and the WQv-ED orifice is sized to release the EDv within 24 hours. • According to Step 6 the orifice diameter calculated to release the 2.55 ac-ft WQv within 24 hours (resulting in a release rate = 1.29 cfs). Therefore, the Cpv requirements are essentially included in the design. No additional volume is recommended. • Based on the TR-55 output data, a CMDT of 23 hours was achieved in this design. Additional detention may be achieved by either increasing pond volume or an additional practice or control at the outlet of the pond to meet the Cpv requirement (not included in example).
Example 1B See Chapter 8 of the Design Manual for example calculations for the remaining steps, which cover calculations for: • Step 8: Calculate Qp10 (10-year storm) release rate and water surface elevations; • Step 9: Calculate Qp100 (100-year storm) release rate and water surface elevation, size emergency spillway, calculate 100-year water surface elevation, and • Step 10: Check for safe passage of Qp100 under ultimate build-out conditions and set top of embankment elevation.
Example 2: Filter Design in a Commercial Development
Example 2 Lake Center is a 4.5-acre hypothetical commercial site located in the New York City watershed (east of Hudson). A five-story office building and associated parking are proposed within the catchment. The catchment has 3.05 acres of impervious cover (i.e., the site is 68% impervious). The pre-developed site is a mixture of forest and meadow. On-site soils are predominantly HSG “B” soils.
Example 2 (cont.) Step 1. Develop Site Hydrologic Input Parameters and Calculate Water Quality Volume • This example will focus on meeting the water quantity requirements. Channel Protection Volume, (Cpv), Overbank Flood Protection Volume (Qp10), and the Extreme Flood Protection Volume (Qf) are not addressed in this example. Water Quality Volume, WQv • The design storm is the 1-year, 24-hour, Type III rainfall event. Based on rainfall map chose 2.8-inches as the 1-year rainfall event based on the site location. • In final stabilization of the site, soil decompaction practices are applied to all disturbed area. Because of soil restoration practice, hydrologic soil group curve numbers applied to the grass areas are kept at their pre-construction value. • Using TR-55 and the post-development watershed, the resulting peak runoff rate is = 5.4 cfs.
Example 2 (cont.) Step 1. Develop Site Hydrologic Input Parameters and Calculate Water Quality Volume (cont.) The following provides a summary of TR-55 hydrologic calculation for WQv and discharge rate:
Example 2 (cont.) Step 1. Develop Site Hydrologic Input Parameters and Calculate Water Quality Volume (cont.) • Therefore: WQv = 0.54 ac-ft or 23,224ft3
Example 2 (cont.) Step 2. Evaluate the Development Site for Appropriate Source Control Practices and Application of Surface Sand Filter • Grass swales and rain gardens are found to be suitable for this site. Infiltration capacity of the site (HSG B) allows infiltration and reduction of the runoff volume. • The conventional plan identified 8 traffic islands which can be used for siting of a rain garden or bioretention area. • A section of the conveyance system is also modified to collect the sheet flow and shallow concentrated flow into a grass swale. • Grass swales allow some storage and infiltration. • By incorporating these practices, the plan meets the source control requirement for routing 20% of impervious area through BSD practices.
Example 2 (cont.) Step 2. Evaluate the Development Site for Appropriate Source Control Practices and Application of Surface Sand Filter (cont.) • (3.05 acres) (43,560) (0.2) = 26,572 ft2 • About 0.6 acre of the site will be connected to a bioretention area with infiltration capacity (without underdrain pipe) and a grass swale. • Bioretention area calculations are similar to Example 1. • Swale capacity is calculated using standard open-channel hydraulic design calculations to maintain shallow depths and low velocities. • For the design of filters, head limitations are evaluated. • Existing ground elevation at the practice location is 222.0 feet, mean sea level. • Soil boring observations reveal that the seasonally high water table is at 211.0 feet. • Adjacent drainage channel invert is at 213.0 feet.
Example 2 (cont.) Step 3. Compute Source Control Flow Reduction • The site is designed to route the runoff from 0.6 acre of the impervious area through a bioretention area, overflow to an open channel and eventually flow to the proposed filter system. • An overflow is designed to convey the overflow from the bioretention cell from larger storms into the swale. • Contributing areas consist of 0.6 acre of rooftop, and 1 acre of grass area. About 300 ft2 of bioretention area is considered for each 1000 ft2 of rooftop, which results in a total bioretention area of 6,500 ft2. The rest of the impervious and landscaped areas discharge to a grass swale, which also conveys the overflow from the bioretention area.
Example 2 (cont.) Step 3. Compute Source Control Flow Reduction (cont.) • Summary of Bioretention Area Sizing
Example 2 (cont.) Step 3. Compute Source Control Flow Reduction (cont.) • A grass swale is designed to convey the runoff from this sub-catchment. The grading of the site is planned to be less than 4% slope so no check dams are required and the swale provides conveyance with some infiltration and filtering of runoff. • Routing the flow through the grass swale increases the time of concentration. • The final water quality volume for the filter can be found by subtracting the volume in the BSD components from the water quality volume in the traditional site design or: WQv = (23,224 ft3) – (7,150 ft3) = 16,074 ft3
Example 2 (cont.) Step 4. Compute Available Head and Peak Discharge (QWQ). • Determine available head: • The low point at the parking lot is 223.5. Subtract 2' to pass the Q10 discharge (221.5) and a half foot for the inflow channel to the facility (221.0). • The low point at the channel invert, is 213.0. Set the outfall underdrain pipe 1.0’ above the drainage channel invert and add 0.5’ to this value for the drain slope (214.5). Add to this value 8" for the gravel blanket on top of the underdrains and 18" for the sand bed (216.67). • The total available head is 221.0 - 216.67 or 4.33 feet. • Therefore, the available average depth (hf) = 4.33' / 2 = 2.17 feet.
Example 2 (cont.) Step 4. Compute Available Head and Peak Discharge (QWQ) (cont). • Compute Peak Water Quality Discharge: • The peak rate of discharge for the water quality design storm is needed for the sizing of diversion structures. The discharge rate is derived from the hydrology calculation in table developed in Step 1. • A similar calculation is performed to incorporate the flow reduction and increase time of concentration and peak reduction as a result of the BSD approach. • The source control practices discussed above result in reduction of peak discharge by 12%. • The flow splitter outlet structure is designed to convey the 1-year storm to the sedimentation chamber and filter and safely bypass the 10-year storm to the conveyance system.
Example 2 (cont.) Step 5. Sizing of Diversion Structure and Filtering System • At this point, all the steps are similar to steps 4 through 9 of Chapter 8 of the Design Manual. • The methodology for sizing of flow splitter outlet structure for diversion of the design storm (1-year), filter bed chamber volume within practice, filter bed overflow weir size and sedimentation chamber, all remain the same as defined in Chapter 8. • The key equations include: • Orifice equation for sizing of diversion structure low flow orifice: Q = CA(2gh)1/2 ; • Weir equation for sizing of the 10-year storm by pass weir: Q = CLH3/2 • Darcy's Law for sizing of the filter bed Af = WQv (df) / [k (hf + df) (tf)] • The requirement for enhanced phosphorus removal for sand filters is similar to conventional sizing of the filtering systems. The entire treatment system (including pretreatment) shall be sized to temporarily hold at least 75% of the WQv prior to filtration.
Example 2 (cont.) Step 5. Sizing of Diversion Structure and Filtering System (cont). • Summary of Filter Bed Design
Question 3 • What effects do BSD volume reductions have on sizing of filters? • What effects do BSD peak flow reductions have on sizing of filters?