CO2 Measurement Comparison: WP-3D vs. DC-8 and Falcon Analysis
This document presents a comprehensive analysis comparing CO2 measurements from the WP-3D and DC-8 aircraft, along with the DLR Falcon. The analysis covers average differences and uncertainties, focusing on the Prudhoe Bay plume and the inhomogeneity in sampling fine plume structures. Key findings include an average CO2 differential of -0.002 ± 0.186 ppmv between WP-3D and DC-8, with reported 1σ uncertainties of 0.25 ppmv for DC-8 and 0.14 ppmv for WP-3D, and an analysis of sampling distances.

CO2 Measurement Comparison: WP-3D vs. DC-8 and Falcon Analysis
E N D
Presentation Transcript
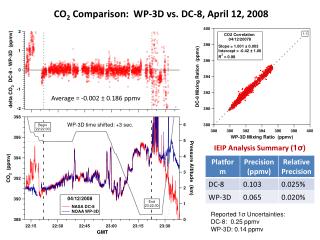
CO2 Comparison: WP-3D vs. DC-8, April 12, 2008 Average = -0.002 ± 0.186 ppmv WP-3D time shifted: +3 sec. IEIP Analysis Summary (1σ) Reported 1σ Uncertainties: DC-8: 0.25 ppmv WP-3D: 0.14 ppmv
CO2 Comparison: NASA DC-8 vs. DLR Falcon – 07/09/2008 Distance < 200 m IEIP Analysis Summary (1σ) Reported 1σ Uncertainties: DC-8: 0.25 ppmv Falcon: