Ratio estimation under SRS
Ratio estimation under SRS. Assume Absence of nonsampling error SRS of size n from a pop of size N Ratio estimation is alternative to under SRS, uses “auxiliary” information ( X ) Sample data: observe y i and x i Population information

Ratio estimation under SRS
E N D
Presentation Transcript
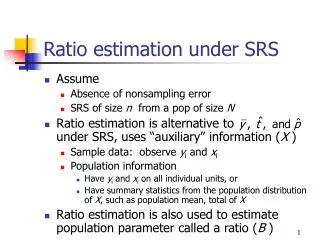
Ratio estimation under SRS • Assume • Absence of nonsampling error • SRS of size n from a pop of size N • Ratio estimation is alternative to under SRS, uses “auxiliary” information (X ) • Sample data: observe yi and xi • Population information • Have yi and xi on all individual units, or • Have summary statistics from the population distribution of X, such as population mean, total of X • Ratio estimation is also used to estimate population parameter called a ratio (B )
Uses • Estimate a ratio • Tree volume or bushels per acre • Per capita income • Liability to asset ratio • More precise estimator of population parameters • If X and Y are correlated, can improve upon • Estimating totals when pop size N is unknown • Avoids need to know N in formula for • Domain estimation • Obtaining estimates of subsamples • Incorporate known information into estimates • Postratification • Adjust for nonresponse
Estimating a ratio, B • Population parameter for the ratio: B • Examples • Number of bushels harvested (y) per acre (x) • Number of children (y) per single-parent household (x) • Total usable weight (y) relative to total shipment weight (x) for chickens
Estimating a ratio • SRS of n observation units • Collect data on y and x for each OU • Natural estimator for B ?
Estimating a ratio -2 • Estimator for B • is a biased estimator for B • is a ratio of random variables
Bias of – 2 • Bias is small if • Sample size n is large • Sample fraction n/N is large • is large • is small (pop std deviation for x) • High positive correlation between X and Y (see Lohr p. 67)
Estimated variance of estimator for B • Estimator for • If is unknown?
Variance of • Variance is small if • sample size n is large • sample fraction n/N is large • deviations about line e = y Bx are small • correlation between X and Y close to 1 • is large
Ag example – 1 • Frame: 1987 Agricultural Census • Take SRS of 300 counties from 3078 counties to estimate conditions in 1992 • Collect data on y , have data on x for sample • Existing knowledge about the population
Ag example – 2 • Estimate 0.9866 farm acres in 1992 relative to 1987 farm acres
Ag example – 3 • Need to calculate variance of ei ’s
Ag example – 4 • For each county i, calculate • Coffee Co, AL example • Sum of squares for ei
Estimating proportions • If denominator variable is random, use ratio estimator to estimate the proportion p • Example (p. 72) • 10 plots under protected oak trees used to assess effect of feral pigs on native vegetation on Santa Cruz Island, CA • Count live seedlings y and total number of seedlings x per plot • Y and X correlated due to common environmental factors • Estimate proportion of live seedlings to total number of seedlings
Estimating population mean • Estimator for • “Adjustment factor” for sample mean • A measure of discrepancy between sample and population information, and • Improves precision if X and Y are + correlated
y 0 x Underlying model with B > 0 • B is a slope • B > 0 indicates X and Y are positively correlated • Absence of intercept implies line must go through origin (0, 0) 0
Using population mean of X to adjust sample mean • Discrepancy between sample & pop info for X is viewed as evidence that same relative discrepancy exists between
Bias of • Ratio estimator for the population mean is biased • Rules of thumb for bias of apply
Estimator for variance of • Estimator for variance of
Ag example – 9 • Expect a linear relationship between X and Y (Figure 3.1) • Note that sample mean is not equal to population mean for X
MSE under ratio estimation • Recall … • MSE = Variance + Bias2 • SRS estimators are unbiased so • MSE = Variance • Ratio estimators are biased so • MSE > Variance • Use MSE to compare design/estimation strategies • EX: compare sample mean under SRS with ratio estimator for pop mean under SRS
Sample mean vs. ratio estimator of mean • is smaller than if and only if • For example, if and ratio estimation will be better than SRS
Estimating the MSE • Estimate MSE with sample estimates of bias and variance of estimator • This tends to underestimate MSE • and are approximations • Estimated MSE is less biased if • is small (see earlier slide) • Large sample size or sampling fraction • High + correlation for X and Y • is a precise estimate (small CV for ) • We have a reasonably large sample size (n > 30)
Estimating population total t • Estimator for t • Is biased? • Estimator for
B1slope y B0 x Regression estimation • What if relationship between y and x is linear, but does NOT pass through the origin • Better model in this case is
Regression estimation – 2 • New estimator is a regression estimator • To estimate , is predicted value from regression of y on x at • Adjustment factor for sample mean is linear, rather than multiplicative
Estimating population mean • Regression estimator • Estimating regression parameters
Estimating pop mean – 2 • Sample variances, correlation, covariance
Estimating variance • Note: This is a different residual than ratio estimation (predicted values differ)
Estimating the MSE • Plugging sample estimates into Lohr, equation 3.13:
Estimating population total t • Is regression estimator for t unbiased?
Tree example • Goal: obtain a precise estimate of number of dead trees in an area • Sample • Select n = 25 out of N = 100 plots • Make field determination of number of dead trees per plot, yi • Population • For all N = 100 plots, have photo determination on number of dead trees per plot, xi • Calculate = 11.3 dead trees per plot
Tree example – 2 • Lohr, p. 77-78 • Data • Plot of y vs. x • Output from PROC REG • Components for calculating estimators and estimating the variance of the estimators • We will use PROC SURVEYREG, which will give you the correct output for regression estimators
Tree example – 3 • Estimated mean number of dead trees/plot • Estimated total number of dead trees
Tree example – 4 • Due to small sample size, Lohr uses t -distribution w/ n 2 degrees of freedom • Half-width for 95% CI • Approx 95% CI for ty is (1115, 1283) dead trees
B1slope y B0 x Related estimators • Ratio estimator • B0 = 0 ratio model • Ratio estimator regression estimator with no intercept • Difference estimation • B1 = 1 slope is assumed to be 1
Domain estimation under SRS • Usually interested in estimates and inferences for subpopulations, called domains • If we have not used stratification to set the sample size for each domain, then we should use domain estimation • We will assume SRS for this discussion • If we use stratified sampling with strata = domains, then use stratum estimators (Ch 4) • To use stratification, need to know domain assignment for each unit in the sampling frame prior to sampling
Stratification vs. domain estimation • In stratified random sampling • Define sample size in each stratum before collecting data • Sample size in stratum h is fixed, or known • In other words, the sample size nhis the same for each sample selected under the specified design • In domain estimation • nd = sample size in domain d is random • Don’t know nd until after the data have been collected • The value of nd changes from sample to sample
d=1 d=2 . . . . . . d=D Domain #1 Population partitioned into domains Domain D • Recall U = index set for population = {1, 2, …, N } • Domain index set for domain d = 1, 2, …, D • Ud = {1, 2, …, Nd } where Nd= number of OUs in domain d in the population • In sample of size n • nd = number of sample units from domain d are in the sample • Sd = index set for sample belonging to domain d
Boat owner example • Population • N = 400,000 boat owners (currently licensed) • Sample • n = 1,500 owners selected using SRS • Divide universe (population) into 2 domains • d = 1 own open motor boat > 16 ft. (large boat) • d = 2 do not own this type of boat • Of the n = 1500 sample owners: • n1 = 472 owners of open motor boat > 16 ft. • n2 = 1028 owners do not own this kind of boat
New population parameters • Domain mean • Domain total
Boat owner example - 2 • Estimate population domain mean • Estimate the average number of children for boat owners from domain 1 • Estimate proportion of boat owners from domain 1 who have children • Estimate population domain total • Estimate the total number of children for large boat owners (domain 1)