Estimation of Covariance Matrix Under Informative Sampling: Insights from Tartu Research
120 likes | 240 Vues
This presentation explores the estimation of the covariance matrix under informative sampling, highlighting how sample distributions can differ from population distributions based on the variable of interest. The study focuses on multivariate normal distributions and the implications of inclusion probabilities in statistical sampling. Key findings include the preservation of independence only under certain conditions, and results from a simulation study comparing bivariate standard normal populations. This research is fundamental for understanding biases in sampling and statistical estimation.

Estimation of Covariance Matrix Under Informative Sampling: Insights from Tartu Research
E N D
Presentation Transcript
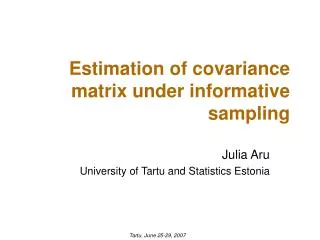
Estimation of covariance matrix under informative sampling Julia Aru University of Tartu and Statistics Estonia Tartu, June 25-29, 2007
Outline • Informative sampling • Population and sample distribution • Multivariate normal distribution and exponential inclusion probabilities • Conclusions for normal case • Simulation study Tartu, June 26-29, 2007
Informative sampling • Probability that an object belongs to the sample depends on the variable we are interested in • For example: while studying income we see that people with higher income are not keen to respond • Under informative sampling sample distribution of variable(s) of interest differs from that in population Tartu, June 26-29, 2007
Population and sample distribution • Vector of study variables • Population distribution • Sample distribution Tartu, June 26-29, 2007
MVN case (1) • Population distribution: multivariate normal with parameters µ and Σ: • Inclusion probabilities: • Matrix A is symmetrical and such that is positive-definite Tartu, June 26-29, 2007
MVN case (2) • Sample distribution is then again normal with parameters Tartu, June 26-29, 2007
Conclusions for MVN case • If variables are independent in the population (Σ is diagonal) then independence is preserved only in the case when matrix A is also diagonal • Matrix A can be chosen to make variables independent in the sample or dependence structure to be very different from that in the population Tartu, June 26-29, 2007
Simulation study (1) • Population is bivariate standard normal with correlation coefficient r : • Inclusion probabilities: • Repetitions: 1000, population size: 10000, sample size: 1000 Tartu, June 26-29, 2007
Simulation study (2) Tartu, June 26-29, 2007
Thank you! Tartu, June 26-29, 2007
Exponential family (1) • Population distribution belongs to expontial family • With canonocal representation • And inclusion probabilities have the form Tartu, June 26-29, 2007
Exponential family (2) • Then sample distribution belonds to the same family of distributions with canonical parameters Tartu, June 26-29, 2007