Download
1 / 11
110 likes | 219 Vues
Explore historical rapeseed yields in La Meuse, identifying underlying weather causes for bad yields, using data to determine frequency of returns, addressing homogeneity issues, and de-trending data to pinpoint "bad" years since 1980.

E N D
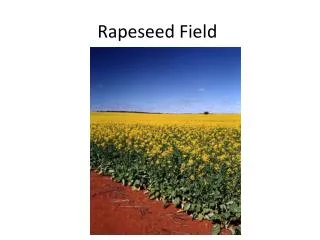
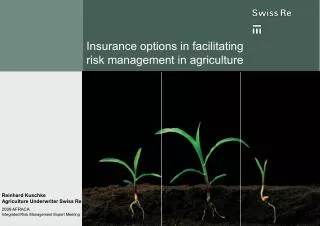
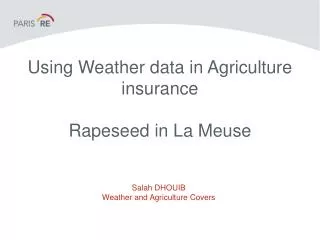
Using Weather data in Agriculture insuranceRapeseed in La Meuse Salah DHOUIB Weather and Agriculture Covers
Historical rapeseed yield in La Meuse • Identification of the underlying weather causes of a bad yield: lack and/or excess rainfall, heat-wave, etc • Using weather data to determine the frequency and period of return
Using Historical yield data • Homogeneity Problem due to technical progress in the farming industry • Availability problems: electronic data is not always easy to find • Homogeneity Problem due to classification changes • Target: De-trending data and identifying “bad” years
Rapeseed: Historical and de-trended yield in La Meuse since 1980 3 Low yield years: 83, 92 and 2001
Clear trend up to the nineties due to technical progress • 3 catastrophic years: 1983, 1992 and 2001
Underlying weather causes • Objective • Identifying key weather factors explaining bad yield • How ? • Agronomic knowledge • Analysis of the correlation between extreme historical weather conditions and bad yield
Identifying weather factors: pre-harvest drought • Example : Risk type « 2001 » : May June draught in La Meuse Ressources hydriques fin juin Vs moyenne 1950-2006
May June rainfall in Metz: Meteo-France data 2001 pre-harvest draught
May 15th-June 10th rainfall in Metz: Harvest Period “Flood” 1983, 1992 and 1994 harvest « floods »
Weather data / Yield data correlation • Very complicated compared to say Energy sector • More complicated in Europe where agriculture is less dependent on “Mother Nature” • Bigger distance between weather station and the location of the risk: we need airports near farms • Agriculture uses non-continuous weather phenomena: frost, rainfall, hail • Axis of development: NDVI type of index, Satellite imagery, etc